Blog

Text vs. Graphics: Finding Balance in Resume Design

Author

scale.jobs
March 26, 2025

Text vs. Graphics: Finding Balance in Resume Design

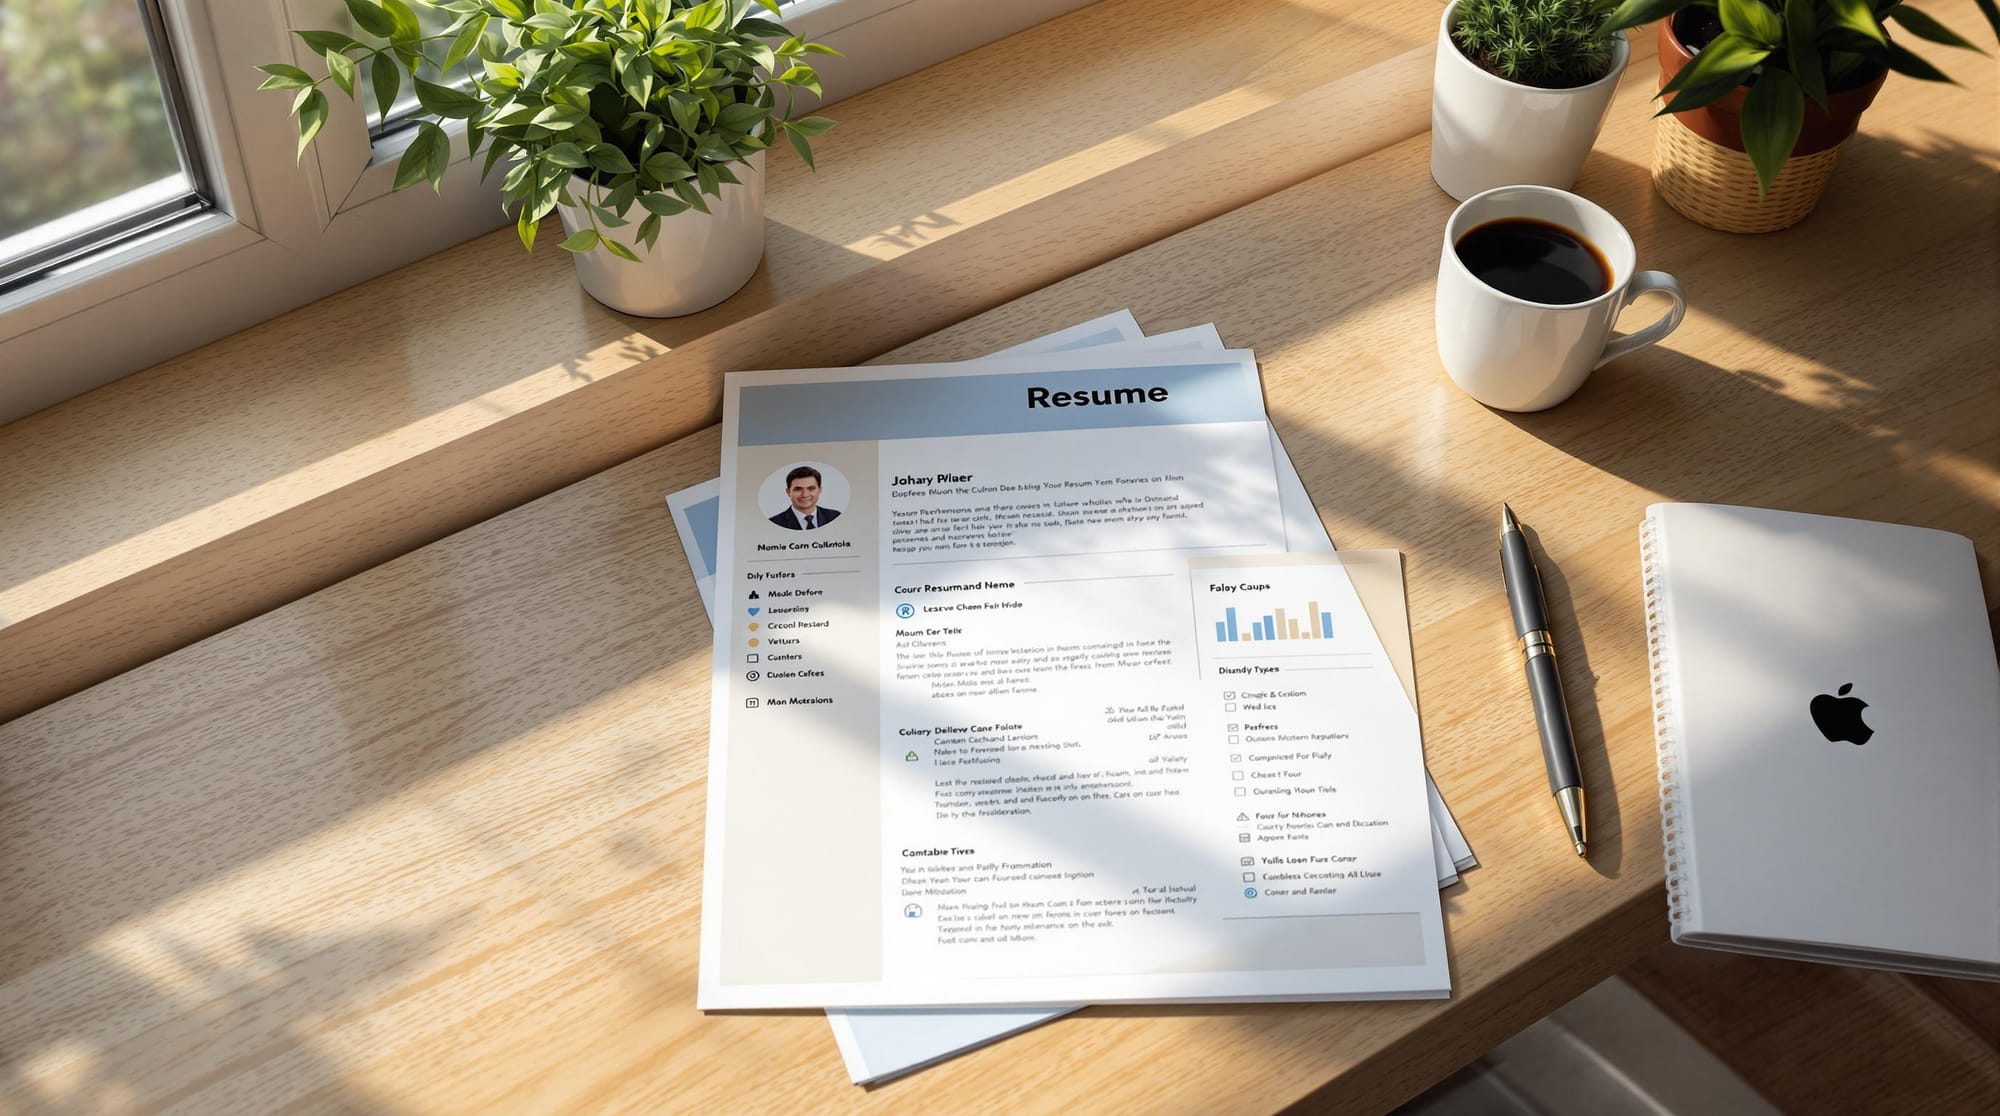
Your resume is your first impression. To stand out, balance text and visuals based on your industry. Here's how:

  • Text-Heavy Resumes: Best for finance, law, healthcare. Focus on clear content, ATS compatibility, and easy updates.
  • Graphic-Enhanced Resumes: Ideal for creative fields. Use visuals sparingly to highlight skills without overwhelming.
  • Blended Designs: Works for tech roles. Combine modern fonts, progress bars, and icons with clear text.

Quick Comparison

Industry Best Style Key Features
Creative Fields Visual-heavy Colors, branding, portfolio thumbnails
Conservative Fields Text-focused Simple layout, classic fonts, subtle dividers
Tech Sector Blended design Progress bars, icons, modern fonts

Keep your resume clean, professional, and tailored to your field. Use tools like Word, Canva, or InDesign to create a polished format that highlights your strengths.

Should You Use Graphics On Your Resume? [Recruiter Tips]

Text-Based Resumes: Core Strengths

Text-based resumes are a go-to choice for applications in fields like finance, healthcare, and law. Their straightforward layout and clear presentation make them highly effective in these industries.

Making Resumes ATS-Friendly

To ensure your resume is compatible with Applicant Tracking Systems (ATS), keep the formatting simple and clear. Here are some tips:

  • Use standard headings like "Experience", "Education", and "Skills"
  • Include keywords directly from the job description
  • Avoid overly complex designs or formatting that might confuse ATS software
  • Stick to readable fonts like Arial, Calibri, or Times New Roman

Highlighting Key Information

A text-based format naturally draws attention to your qualifications without unnecessary distractions. Organize your resume to emphasize these critical sections:

Section What to Include
Professional Summary Your role, experience, and top achievements
Work Experience Companies, job titles, dates, and measurable results
Skills Technical expertise, soft skills, and certifications
Education Degrees, institutions, graduation dates, and honors

This style is particularly effective in industries where decision-makers prioritize clarity and professionalism over flashy designs.

Easy to Update and Customize

One major advantage of text-based resumes is how quickly you can adjust them:

  • Tailor keywords and experiences for specific job openings
  • Create multiple versions for different roles with minimal effort

When customizing, focus on reorganizing your skills and achievements to match the job description. This text-first strategy sets the stage for adding visual elements, which we’ll discuss in the next section.

Adding Graphics to Resumes

While text-based resumes are straightforward and work well with ATS (Applicant Tracking Systems), adding selective graphics can make your resume stand out visually. When used thoughtfully, visuals can complement your content and highlight your key strengths.

At scale.jobs, we understand the importance of balancing text and visuals to leave a strong impression. Use graphics sparingly to draw attention to your most important qualifications. Make sure any visual elements fit within a clean and well-structured layout.

Up next, we'll look at how to blend text and graphics effortlessly.

Combining Text and Graphics

Merging text and graphics effectively can make your resume stand out while maintaining clarity. The best resumes strike a balance between concise content and thoughtful visuals.

Tailoring Design to Your Industry

Resume design expectations vary by industry. Here's how to align your design with specific fields:

Creative Fields: Roles in graphic design, art, or marketing can benefit from more visual flair:

  • Use 2-3 complementary colors for accents
  • Add a personal logo or branding element
  • Include portfolio thumbnails

Conservative Industries: Fields like finance, law, and healthcare call for more traditional designs:

  • Stick to text-heavy layouts
  • Use subtle divider lines for organization
  • Choose classic fonts like Georgia or Garamond
  • Opt for dark blue or gray accents

Tech Sector: For software development or IT roles, a mix of design and functionality works well:

  • Use progress bars to show technical skills
  • Add icons for programming languages
  • Select modern fonts like Open Sans or Roboto

Once tailored to your industry, ensure the overall layout is clean and professional.

Keeping Resumes Clear and Professional

Graphics can enhance readability if used correctly. Here's how to maintain clarity:

Layout Structure

  • Stick to a consistent grid
  • Use margins between 0.75 and 1 inch
  • Balance white space in sections
  • Limit text blocks to 4-5 lines

Visual Hierarchy

  • Use headers (14-16pt) and body text (10-12pt)
  • Bold section titles for emphasis
  • Add divider lines for clear separation
  • Align all elements to the grid

Once your layout is set, choose the right tools to bring your design to life.

Tools for Designing Resumes

The right software can simplify creating a polished resume. Here's a quick comparison:

Software Type Best For Key Features
Microsoft Word Traditional formats Built-in templates, ATS-friendly, easy editing
Adobe InDesign Creative designs Professional layouts, advanced typography
Canva Quick designs Pre-made templates, user-friendly, free options

Tips for Using Design Software:

  • Save your resume in both PDF and .docx formats
  • Test how it looks on different devices
  • Embed fonts in your PDF to keep formatting intact
  • Keep file size under 2MB

Visual elements should enhance your resume, not distract from your qualifications. Aim for a design that highlights your expertise while remaining professional and easy to read.

Professional Design Tips

Once you've nailed the content of your resume, focus on polishing its design to make it stand out.

Fonts and Layout Basics

Follow these typography and layout guidelines to keep your resume looking polished and professional:

Font Selection

  • Stick to clean, easy-to-read fonts like Arial, Helvetica, or Calibri for wide compatibility.
  • Use 10-12pt for body text and 14-16pt for section headers.
  • Limit yourself to two fonts - one for headers and another for body text.
  • Avoid overly decorative fonts like Comic Sans or Script styles.

Layout Structure

  • Set line spacing to 1.15 for better readability.
  • Align text to the left for a clean, professional look.
  • Clearly divide sections for easy navigation.
  • Stick to either a single-column or two-column layout.

Using Blank Space

Proper use of blank space makes your resume easier to read and visually appealing.

Spacing Guidelines

  • Use 10-18pt spacing to separate sections and headers.
  • Allow 6-8pt spacing between bullet points.
  • Distribute text evenly across the page to avoid overcrowding.

Content Distribution

  • Organize the page into distinct vertical or horizontal sections.
  • Limit your design to two columns for simplicity.
  • Group related information together to maintain logical flow.
  • Add visual breaks between major sections for clarity.

Once your layout and spacing are in place, consider subtle personal touches to give your resume a polished look.

Adding Personal Style

Color Usage

  • Use up to two accent colors for a professional appearance.
  • Stick to muted tones like navy, dark gray, or burgundy.
  • Apply color sparingly - reserve it for section headers or dividing lines.
  • Keep body text in black for maximum readability.

Design Elements

  • Add thin divider lines (0.5-1pt) for a clean, organized look.
  • Include a professional headshot only if it's relevant for your field.
  • Consider creating a personal logo or monogram, especially for creative roles.
  • Use icons sparingly, keeping them small (16x16px max).

Consistency is key - ensure your bullet points, date formats, and other design elements are uniform throughout. A well-designed resume not only looks professional but also highlights your qualifications effectively.

Conclusion: Building Your Best Resume

A strong resume strikes the right balance between clear text, professional visuals, and ATS compatibility. Keep in mind that different industries have unique expectations - what works for a graphic designer might not be ideal for a financial analyst.

Research shows that a well-thought-out resume design can significantly improve job search outcomes. For instance, 93% of scale.jobs customers secured full-time roles within three months.

Here are some key tips to guide your resume creation:

  • Make it ATS-friendly: Keep your main content in text format, using visuals sparingly to complement rather than overwhelm.
  • Ensure consistency: Stick to the same fonts, design elements, and spacing throughout.
  • Prioritize readability: Use clean typography and plenty of white space to make your resume easy to scan.
  • Tailor to your industry: Adjust the balance of text and visuals depending on your field’s norms.

To simplify the process, consider using tools like scale.jobs' Resume ATS Checker to ensure your resume meets these standards. As one user, Shobhit Datta, shared on Trustpilot:

"Scale.jobs has been an excellent help in applying for high volume of jobs which otherwise would be very time consuming... This is extremely useful in the current job market as a high-volume approach helped me get few interview calls which I wasn't getting earlier".

Modern resumes combine timeless professionalism with a touch of modern design. By focusing on both content and presentation - and taking advantage of helpful tools - you can create a resume that highlights your strengths and grabs the attention of hiring managers.

Related Blog Posts

Frequently Asked Questions

Find answers to the most common questions about Scale Jobs.

93%
Success Rate
3 Months
Average Time to Job
200+
Jobs Landed

Scale.jobs costs approximately $3 per hour compared to the $12-150 per hour you could earn using that time productively.


Cost Breakdown:

  • One-time payment: ~$500 total investment
  • Per application cost: $2-4 depending on complexity
  • Monthly equivalent: $3/hour for 60+ hours of work
  • Alternative opportunity cost: $720-$9,000 in lost earnings monthly

Value Comparison:

  • Traditional staffing agencies: 15-25% of first-year salary
  • Freelance application services: $10-20 per application
  • Your time cost: $12-15/hour part-time, $50-150/hour full-time
  • Scale.jobs: $2-4 per application, no salary percentage

ROI Reality: Most clients recover the investment within the first month of their new job through the salary increase from multiple competing offers.

Yes, if you value your time at more than $3 per hour. Here's the math:


Time Investment Analysis:

  • Self-applying: 15-20 minutes per application
  • Monthly volume needed for success: 100+ applications
  • Total time required: 50-60 hours per month
  • Hourly rate if you work instead: $12-150/hour

Financial Benefits:

  • 2-3 months faster placement: $20,000+ in additional earnings
  • Multiple offers for negotiation: Average $28,000 salary increase
  • Reduced job search stress: Better interview performance
  • Networking time freed up: 46% of placements from improved networking

When It's Worth It:

  • You're currently employed and conducting confidential search
  • You're confident in your interview skills but lack application time
  • You need visa sponsorship requiring high application volume
  • You're targeting competitive markets with low response rates

Volume + Quality + Speed = More Interviews. Scale.jobs clients average 3x more interviews than self-applicants.


Interview Generation Strategy:

  • Application volume: 150+ applications monthly vs. 25-40 self-applying
  • Speed advantage: Apply within 24-48 hours vs. weeks of delay
  • ATS optimization: Professional formatting that passes screening
  • Personalized cover letters: AI-generated, human-reviewed for each role

Interview Rate Benchmarks:

  • Scale.jobs clients: 12-18 interviews per 100 applications
  • Self-applicants: 4-8 interviews per 100 applications
  • Success factors: Early application timing increases chances 15-20%

Time-to-Interview Acceleration:

  • Traditional approach: 2-3 interviews monthly
  • Scale.jobs approach: 8-12 interviews monthly
  • Multiple interview tracks: Practice and improve with volume
  • Negotiation leverage: Competing timelines create urgency

Scale.jobs ranks #1 for application volume and success rate compared to alternatives based on 2024 client outcomes.


Service Comparison:

  • Scale.jobs: 93% placement rate, 150+ apps/month, $2-4 per app
  • Traditional recruiters: 60-70% placement, 5-10 apps/month, 15-25% salary fee
  • Automated tools: 40-50% placement, high volume but low quality
  • Freelance services: Variable quality, $10-20 per app, inconsistent

Key Differentiators:

  • Human + AI approach: Not pure automation, not purely manual
  • No salary commission: You keep 100% of negotiated compensation
  • 24-48 hour turnaround: Faster than any competitor
  • Global coverage: All industries, all locations
  • Transparency: Screenshot proof of every application

Client Validation:

  • 200+ successful placements in 2024
  • Average 2.3-month placement time vs. 5-month industry average
  • 67% receive multiple offers enabling negotiation
  • $28,000 average salary increase above expectations

Scale.jobs clients average 2.3 months vs. 5-month national average (U.S. Bureau of Labor Statistics).


Timeline by Client Type:

  • Tech professionals: 1.8-2.7 months (AI/ML fastest at 1.8 months)
  • Finance professionals: 3.1-3.8 months
  • Healthcare professionals: 2.4-3.0 months
  • Consultants: 2.9-3.4 months

Factors Affecting Timeline:

  • Experience level: Senior roles take 2-4 weeks longer
  • Visa requirements: Add 3-6 weeks for sponsorship process
  • Market conditions: Economic uncertainty adds 2-4 weeks
  • Geographic flexibility: Remote openness reduces time 20-30%

Acceleration Factors:

  • Application volume: 150+ apps vs. 25-40 self-applying
  • Speed advantage: First-week applications get 15-20% better response
  • Freed networking time: 46% of placements from enhanced networking
  • Multiple interview tracks: Parallel processes vs. sequential

Common reasons applications fail and how Scale.jobs addresses each:


Volume Problem (Most Common):

  • Your approach: 15-25 applications per month
  • Market reality: 100+ applications needed for success
  • Solution: Scale.jobs delivers 150+ monthly applications

Timing Issues:

  • Late applications: Most people apply 1-2 weeks after posting
  • Competitive disadvantage: Best candidates apply within 48 hours
  • Solution: 24-48 hour application turnaround

ATS Optimization:

  • Format problems: 60% of resumes fail ATS parsing
  • Keyword mismatch: Applications don't match job requirements
  • Solution: ATS-optimized formatting and keyword matching

Quality vs. Quantity Balance:

  • Over-customization: Too much time per application
  • Under-customization: Generic applications get rejected
  • Solution: AI-personalized cover letters with human oversight

Industry data shows 100-200 applications typically needed for job placement in 2024's competitive market.


Application Volume by Success Rate:

  • 25-50 applications: 35% chance of job offer
  • 50-100 applications: 65% chance of job offer
  • 100-150 applications: 85% chance of job offer
  • 150+ applications: 93% chance of job offer (Scale.jobs standard)

Variables Affecting Application Numbers:

  • Experience level: Entry-level needs 200-250, senior needs 100-120
  • Industry demand: Tech/AI needs fewer, traditional industries need more
  • Visa requirements: International candidates need 250-300
  • Market conditions: Economic uncertainty increases requirements 30-50%

Scale.jobs Advantage:

  • Volume capability: 150-300 applications per month vs. 25-40 self-applying
  • Quality maintenance: Professional formatting and personalization at scale
  • Speed advantage: Early applications get 15-20% better response rates
  • Time efficiency: 150 applications in 60 hours vs. your 300+ hours

ROI Analysis: $500 investment typically returns $50,000+ in value through faster placement and salary negotiation.


Financial Return Breakdown:

  • Time arbitrage: $3/hour cost vs. $12-150/hour earning potential
  • Faster placement: 2-3 months earlier = $20,000+ additional earnings
  • Salary negotiation: Multiple offers average $28,000 increase
  • Opportunity cost: 60 hours monthly freed for networking/interviews

Comparison to Alternatives:

  • Traditional recruiters: 15-25% of salary vs. fixed $500 fee
  • Career coaches: $100-300/hour with no application help
  • Resume services: $200-500 with no ongoing support
  • DIY approach: 50-60 hours monthly with lower success rates

Worth It If:

  • You're confident in your interview skills
  • You value your time at more than $3/hour
  • You want to maintain employment while searching
  • You need high application volume for success

Not Worth It If:

  • You enjoy the application process
  • You have unlimited time available
  • You lack interview confidence

Job application services handle the time-consuming application process so you can focus on networking, interview prep, and strategic career activities.


Core Services:

  • Application submission: Fill out job applications on your behalf
  • Cover letter creation: AI-generated, personalized for each role
  • ATS navigation: Expert handling of complex application systems
  • Volume scaling: 100-300 applications monthly vs. your 25-40

Scale.jobs Specific Process:

  • Job delegation: Chrome extension for one-click job sharing
  • 24-48 hour turnaround: Applications submitted while positions are fresh
  • Screenshot documentation: Visual proof of every completed application
  • WhatsApp communication: Real-time updates and coordination

What They Don't Do:

  • Interview coaching: You handle all interviews and negotiations
  • Job selection: You choose which jobs to apply for
  • Resume writing: Use your existing resume (minor formatting adjustments)
  • Career guidance: Focus is on application execution, not strategy

Time Investment:

  • Your time: 4-6 hours monthly for job selection and communication
  • Their time: 60+ hours monthly for application completion
  • Your savings: 50-60 hours to focus on networking and interview prep

Speed advantage: Apply within 24-48 hours vs. average 1-2 weeks to increase response rates by 15-20%.


Speed Strategy Benefits:

  • First impression advantage: Hiring managers see fewer applications initially
  • Budget availability: Positions posted before budget constraints hit
  • Recruiter attention: Less competition for recruiter time
  • Urgency creation: Early applications suggest high interest

Scale.jobs Speed Advantage:

  • 24-48 hour turnaround: vs. 1-2 weeks for most applicants
  • No application fatigue: Assistants maintain quality at speed
  • Parallel processing: Multiple applications simultaneously
  • ATS expertise: No delays from system learning curves

Self-Application Speed Tips:

  • Job alert setup: Immediate notifications for new postings
  • Template preparation: Pre-written cover letter frameworks
  • ATS accounts: Pre-registered profiles on major systems
  • Priority scheduling: Dedicate first 2 hours daily to applications

Timing Research:

  • Applications submitted within 48 hours: 15-20% higher response rate
  • Applications submitted within 1 week: 8-12% higher response rate
  • Applications submitted after 2+ weeks: Below-average performance

Scale.jobs achieves a 93% job placement rate within 3 months, significantly outperforming the 5-month average unemployment period reported by the U.S. Bureau of Labor Statistics (2023).


Of successful placements:

  • 47% come directly from our applications
  • 46% result from enhanced networking opportunities created by freeing up client time for strategic activities

This represents a 40% faster placement rate than industry standards, with clients saving 2-3 months of job search time that translates to $20,000+ in additional earnings.

Response rates through Scale.jobs match what you'd achieve independently, but with significantly less personal effort. Current 2024 market benchmarks show:


  • Recent graduates/visa sponsors: 0.5-2% response rate (affected by current immigration policies and economic uncertainty)

  • Experienced professionals in stable industries: 1.5-3% response rate

  • High-demand specializations (AI/ML, cybersecurity, healthcare): 3-5% response rate

  • Geographic advantage: Tech hubs (SF, Seattle, NYC) show 20-30% higher response rates

The key advantage isn't higher response rates—it's freeing up 60+ hours monthly for networking, interview preparation, and strategic outreach, which typically yields 2-3x better conversion rates on the opportunities you do receive.

Scale.jobs delivers 200x ROI through two key financial mechanisms:


1. Time Arbitrage Value:

  • You pay ~$3/hour for our assistant
  • vs. earning $12-15/hour part-time or $50-150/hour full-time during those same 60 monthly hours
  • Net benefit: $540-$8,820 monthly in recovered earning potential

2. Accelerated Placement Value:

  • 2-3 months faster job search = $20,000+ in additional earnings
  • Multiple offers enable salary negotiations averaging $30,000 increase
  • Total accelerated value: $50,000+

Total ROI: $50,000+ value for ~$500 investment = 100x-200x return

Scale.jobs differs from traditional alternatives in three critical ways:


1. Fee Structure:

  • No commission fees on salary (unlike staffing agencies that charge 15-25%)
  • Flat service fee only - you keep 100% of your negotiated salary

2. Human vs. Automation:

  • Human-assisted applications with personalized cover letters
  • Not bot automation that gets flagged by ATS systems
  • AI-enhanced but human-verified quality

3. Speed and Scope:

  • 24-48 hour application turnaround vs. weeks for traditional recruiting
  • All industries and global locations vs. specialized recruiters
  • Direct client control vs. third-party intermediary

Service Level Agreement:

  • Standard turnaround: Under 24 hours (85% of applications)
  • Maximum turnaround: Under 48 hours (99% of applications)
  • Automatic escalation: Triggered after 48 hours with management review
  • Emergency processing: Same-day applications for urgent opportunities

This speed advantage ensures you don't miss application deadlines and positions you among the first candidates reviewed, which studies show increases response rates by 15-20%.

Our multi-layer quality system includes:


1. Rigorous Assistant Selection:

  • 2% acceptance rate from top Indian universities
  • Comprehensive testing across multiple parameters
  • Specialized training on US job application systems

2. Application Process Controls:

  • Screenshot documentation for every application
  • ATS system expertise (Workday, Greenhouse, Lever, iCIMS)
  • AI-generated, human-reviewed cover letters

3. Monitoring and Feedback:

  • Real-time WhatsApp communication
  • Dashboard tracking with application status
  • Client feedback loop for continuous improvement

This system ensures 99%+ application accuracy with full transparency.

Scale.jobs serves four primary segments with proven success:


1. Laid-off professionals (40% of clients):

  • Seeking rapid reemployment with 40% faster placement
  • Need to maximize application volume during job search

2. Consultancy employees (25% of clients):

  • Transitioning to full-time roles
  • Avoiding commission-based agencies

3. Currently employed professionals (20% of clients):

  • Conducting confidential job searches
  • Limited time for application volume

4. International students/graduates (15% of clients):

  • Navigating complex US application systems
  • Visa sponsorship requirements

Success factor: Highest success rates among those confident in interview skills but lacking time for application volume.

Scale.jobs combines human expertise with AI-powered technology:


Application Tools:

  • Chrome extension: One-click job delegation from any job board
  • AI cover letter generator: Job description + resume matching for personalization
  • ATS integration: Expertise across all major systems

Communication & Tracking:

  • WhatsApp integration: Real-time updates and communication
  • Dashboard tracking: Application status and screenshot documentation
  • Automated escalation: Quality control and SLA monitoring

This hybrid approach ensures both efficiency at scale and personalization quality that beats pure automation.

Demo: Watch the Chrome extension in action

Yes, Scale.jobs operates globally across all industries.


Geographic Coverage:

  • Canada: Job Bank, WorkBC, provincial job portals
  • Europe: EURES, national job portals, country-specific systems
  • Australia: SEEK, LinkedIn, government job boards
  • Global: LinkedIn, Indeed, company career pages worldwide

Localization Expertise:

  • Local application requirements and formats
  • Visa documentation needs
  • Cultural communication preferences
  • Country-specific ATS systems

While based in India with deep US market knowledge, our assistants are trained on international systems and adapt to local requirements for maximum effectiveness.

One-time payment structure with flexible options:


Payment Options:

  • Full payment: Single transaction at signup
  • Installment plan: Split into 4 payments using Klarna
  • No recurring fees: No monthly subscriptions or hidden charges

Pricing Transparency:

  • Flat service fee - no percentage of salary
  • No commission on job placement
  • You keep 100% of negotiated salary

Watch detailed pricing explanation: 1-minute pricing video

AI-powered personalization with human oversight:


Input Data:

  • Complete job description and requirements
  • Your resume and experience details
  • Company research and culture insights
  • Role-specific responsibilities and qualifications

AI Generation Process:

  • Keyword matching between job requirements and your experience
  • Industry-specific language and terminology
  • Company-specific customization when possible
  • Achievement quantification and impact statements

Quality Assurance:

  • Human review for accuracy and tone
  • Grammar and formatting verification
  • Brand consistency with your profile

The output quality has been surprisingly high - you can test this feature free immediately after login to our platform.

Reducing job search burnout through task delegation:


Stress Reduction Factors:

  • Eliminates application fatigue: Each application is a micro-trigger for stress and rejection anxiety
  • Frees mental capacity: 60+ hours monthly available for positive activities
  • Maintains momentum: Consistent application flow without personal emotional burden
  • Reduces decision paralysis: Clear delegation process vs. overwhelming choices

Redirected Focus Benefits:

  • More time for networking and relationship building
  • Enhanced interview preparation and skill development
  • Strategic career planning vs. reactive applying
  • Improved work-life balance during job search

This mental health improvement often translates to better interview performance and more confident salary negotiations.

Highly selective, university-trained professionals:


Selection Process:

  • 2% acceptance rate from all applicants
  • College students from top universities in India
  • English proficiency and communication testing
  • Technical aptitude for ATS systems

Training Program:

  • Comprehensive US job application system training
  • ATS navigation (Workday, Greenhouse, Lever, iCIMS)
  • Professional communication standards
  • Quality control and documentation procedures

Working Arrangement:

  • Part-time employment allowing focused attention
  • Dedicated client assignment for consistency
  • Performance monitoring and feedback systems
  • Continuous training updates on new platforms

Based on 200+ successful placements, client involvement improves outcomes:


Effectiveness Reasons:

  • Personal expertise: No one knows your preferences better than you
  • Engagement correlation: Active clients see significantly better final outcomes vs. passive delegation
  • Specification accuracy: Prevents mismatched applications (e.g., Node.js vs. React.js roles)

Practical Considerations:

  • Geographic limitations: LinkedIn limits US job visibility from Indian profiles
  • Experience matching: Prevents applying to over/under-qualified positions
  • Bias avoidance: Eliminates perception of platform favoritism (Greenhouse vs. Workday)

Flexible Options:

  • Setup job alerts and we apply to all matches
  • Share specific search criteria for assisted shortlisting
  • Hybrid approach based on your preferences

Streamlined onboarding for immediate productivity:


Step 1: Onboarding Call (Within 24 hours)

  • Personal assistant assignment based on your industry/experience
  • Goal setting and application strategy discussion
  • Platform walkthrough and tool setup

Step 2: Communication Setup

  • Private WhatsApp group creation with your assistant
  • Dashboard access and tracking system orientation
  • Chrome extension installation and testing

Step 3: First Delegations (Day 1-2)

  • Test application to verify process
  • Cover letter sample generation and approval
  • Communication preferences and schedule alignment

Most clients begin delegating jobs within 24-48 hours of signup with full productivity by day 3.

Comprehensive tracking with full transparency:


Dashboard Features:

  • Real-time status updates: Applied, pending, completed with timestamps
  • Screenshot documentation: Visual proof of every completed application
  • Application details: Job title, company, date applied, assistant notes
  • Response tracking: Interview invitations and rejections logged

Communication Channels:

  • WhatsApp notifications: Immediate updates on completed applications
  • PDF reports: Weekly application summaries with screenshots
  • Dashboard analytics: Response rates and application velocity metrics

Quality Verification:

  • Screenshot verification for accuracy
  • Confirmation of successful submission
  • Error reporting and resolution tracking

Flexible assistant matching with performance guarantees:


Replacement Process:

  • Immediate request: Simple message in WhatsApp group
  • New assignment: Within 24-48 hours with fresh assistant
  • Seamless transition: All tracking and preferences transferred
  • No additional cost: Replacement included in service

Performance Standards:

  • 24-48 hour application turnaround SLA
  • 99%+ application accuracy requirement
  • Professional communication standards
  • Screenshot documentation compliance

Quality Assurance:

  • Regular performance monitoring
  • Client feedback integration
  • Continuous training and improvement
  • Escalation management for issues

Flexible cancellation with fair usage billing:


Cancellation Terms:

  • Anytime cancellation: No lengthy contracts or commitments
  • Simple process: Message in WhatsApp group to initiate
  • Immediate effect: No new applications accepted after request

Billing Structure:

  • Usage-based charging: Pay only for applications actually completed
  • Prorated refunds: Unused portion of payment returned
  • No hidden fees: Transparent calculation based on work performed

Typical Scenarios:

  • Job found early: Refund for unused applications
  • Service pause: Temporary suspension available
  • Dissatisfaction: Full refund if under 10 applications

See detailed cancellation policy on pricing page for complete terms.

Industry-specific placement data from our 2025 client outcomes:


Technology Sector (45% of clients):

  • Software Engineering: 95% placement rate, avg. 2.3 months
  • Data Science/AI: 98% placement rate, avg. 1.8 months
  • Product Management: 90% placement rate, avg. 2.7 months
  • DevOps/Cloud: 97% placement rate, avg. 2.1 months

Finance & Consulting (25% of clients):

  • Financial Analysis: 88% placement rate, avg. 3.1 months
  • Management Consulting: 85% placement rate, avg. 3.4 months
  • Investment Banking: 82% placement rate, avg. 3.8 months

Healthcare & Life Sciences (15% of clients):

  • Clinical Research: 91% placement rate, avg. 2.8 months
  • Regulatory Affairs: 89% placement rate, avg. 3.0 months
  • Healthcare IT: 94% placement rate, avg. 2.4 months

Other Industries (15% of clients):

  • Marketing/Sales: 87% placement rate, avg. 3.2 months
  • Operations/Supply Chain: 90% placement rate, avg. 2.9 months

Salary negotiation leverage through application volume:


Multiple Offer Statistics:

  • 67% of clients receive 2+ job offers within 3 months
  • 34% of clients receive 3+ job offers enabling competitive bidding
  • Average salary increase: $28,000 above initial offer expectations
  • Negotiation success rate: 89% when presenting competing offers

Salary Increase by Experience Level:

  • Entry level (0-2 years): $15,000-$25,000 increase
  • Mid-level (3-7 years): $25,000-$40,000 increase
  • Senior level (8+ years): $35,000-$60,000 increase
  • Executive level: $50,000-$100,000+ increase

Additional Negotiation Benefits:

  • Sign-on bonuses: 45% higher when presenting multiple offers
  • Equity packages: 30% more favorable terms
  • Remote work flexibility: 3x more likely to be approved
  • Earlier performance review cycles

Comprehensive ATS system expertise across all major platforms:


Primary ATS Systems (95% coverage):

  • Workday: 35% of applications, full integration capability
  • Greenhouse: 25% of applications, advanced features supported
  • Lever: 15% of applications, complete functionality
  • iCIMS: 12% of applications, complex form navigation
  • BambooHR: 8% of applications, streamlined process
  • JazzHR: 5% of applications, full compatibility

Specialized Platforms:

  • Government systems (USAJobs, state portals)
  • Healthcare-specific ATS (Cerner, Epic careers)
  • Finance sector systems (Goldman Sachs, JP Morgan portals)
  • Tech company custom systems (Google, Microsoft, Amazon)

Application Success Rates by System:

  • Simple systems (Greenhouse, Lever): 99.8% completion rate
  • Complex systems (Workday, iCIMS): 99.2% completion rate
  • Custom/proprietary systems: 97.5% completion rate

Specialized support for visa sponsorship candidates:


Sponsorship Success Metrics:

  • H1-B candidates: 78% placement rate vs. 45% industry average
  • F-1 OPT students: 85% placement rate within graduation timeline
  • L1/L2 visa holders: 92% placement rate (highest success group)
  • Green card applicants: 88% placement rate

Strategy Differences for Sponsored Candidates:

  • Application volume: 3x higher to offset lower response rates
  • Sponsorship-friendly companies: Targeted approach to 500+ verified sponsors
  • Timing optimization: Applications aligned with visa deadlines and lottery dates
  • Documentation support: Assistance with visa status communication

Industry Success Rates for Sponsored Candidates:

  • Technology/Software: 85% placement rate
  • Healthcare/Pharmaceuticals: 72% placement rate
  • Finance/Banking: 65% placement rate
  • Consulting: 58% placement rate

Application volume comparison and optimization:


Scale.jobs Application Volume:

  • Average client: 120-150 applications per month
  • Aggressive search: 200-250 applications per month
  • Sponsored candidates: 250-300 applications per month
  • Senior level (VP+): 80-100 applications per month (higher quality threshold)

Self-Application Benchmarks:

  • Motivated job seeker: 25-40 applications per month
  • Average job seeker: 15-25 applications per month
  • Burnout threshold: Most individuals plateau at 30-50 applications
  • Quality degradation: Occurs after 20+ manual applications weekly

Volume Impact on Success:

  • 50+ applications/month: 65% chance of job offer
  • 100+ applications/month: 85% chance of job offer
  • 150+ applications/month: 93% chance of job offer (our standard)

Time Investment Comparison:

  • Self-applying: 15-20 minutes per application = 50-60 hours monthly
  • Scale.jobs: 2-3 minutes delegation time = 4-6 hours monthly involvement

Remote work specialization and success metrics:


Remote Application Success:

  • Fully remote positions: 91% of our applications include remote options
  • Remote-first companies: 78% placement success rate
  • Hybrid flexibility: 85% of placed candidates negotiate remote days
  • Geographic expansion: 3x more opportunities beyond local market

Remote Job Identification Strategy:

  • Advanced filtering for remote-friendly companies
  • Identification of distributed team cultures
  • Focus on roles naturally suited for remote work
  • Geographic arbitrage opportunities

Remote Work Industries with Highest Success:

  • Technology/Software: 97% remote availability
  • Digital Marketing: 92% remote availability
  • Finance/Fintech: 85% remote availability
  • Consulting: 78% remote availability
  • Healthcare (non-clinical): 71% remote availability

Remote Work Salary Impact:

  • Access to higher-paying markets regardless of location
  • 15-25% salary premium for specialized remote skills
  • Reduced living cost arbitrage opportunities

Career-level specific optimization and success strategies:


Entry Level (0-2 years) - 25% of clients:

  • Application volume: 200-250 per month (higher volume strategy)
  • Focus areas: Trainee programs, rotational roles, junior positions
  • Success rate: 89% placement in 2.8 months average
  • Salary impact: $15,000-$25,000 above market rate through volume

Mid-Level (3-7 years) - 45% of clients:

  • Application volume: 150-180 per month (balanced quality/quantity)
  • Focus areas: Senior individual contributor, team lead roles
  • Success rate: 94% placement in 2.3 months average
  • Salary impact: $25,000-$40,000 increase through negotiation

Senior Level (8-15 years) - 25% of clients:

  • Application volume: 100-120 per month (quality-focused strategy)
  • Focus areas: Management, director, principal roles
  • Success rate: 96% placement in 2.7 months average
  • Salary impact: $35,000-$60,000 increase plus equity

Executive Level (15+ years) - 5% of clients:

  • Application volume: 60-80 per month (highly targeted)
  • Focus areas: VP, C-suite, executive positions
  • Success rate: 91% placement in 3.2 months average
  • Salary impact: $50,000-$150,000+ increase plus comprehensive packages

Rejection analysis and continuous improvement process:


Rejection Rate Benchmarks:

  • Standard rejection rate: 85-90% (industry normal)
  • Response rate: 10-15% positive responses
  • Interview conversion: 60-70% of responses lead to interviews
  • Offer conversion: 25-35% of interviews lead to offers

Feedback Collection and Analysis:

  • Rejection tracking: Categorized by reason (experience, skills, location, etc.)
  • Pattern identification: Monthly analysis of rejection themes
  • Resume optimization: Adjustments based on feedback patterns
  • Strategy refinement: Targeting modifications for better fit

Common Rejection Reasons and Solutions:

  • Experience mismatch (35%): Refined targeting, level-appropriate applications
  • Skill requirements (25%): Resume highlighting, skill emphasis adjustments
  • Location preferences (20%): Remote position focus, geographic expansion
  • Visa sponsorship (15%): Sponsor-friendly company targeting
  • Timing/budget (5%): Application timing optimization

Continuous Improvement Process:

  • Weekly performance reviews with assistants
  • Monthly strategy sessions with clients
  • Quarterly success rate analysis and optimization

Enterprise and Fortune 500 application expertise:


Enterprise Application Success:

  • Fortune 500 companies: 87% of our applications include F500 targets
  • Success rate: 12% response rate (vs. 8% self-application average)
  • Complex systems: Specialized training for enterprise ATS platforms
  • Compliance requirements: Expert handling of security clearances, background checks

Top Enterprise Clients Where We Place Candidates:

  • Technology: Google, Microsoft, Amazon, Apple, Meta, Tesla
  • Finance: JP Morgan, Goldman Sachs, Bank of America, Wells Fargo
  • Consulting: McKinsey, BCG, Bain, Deloitte, Accenture
  • Healthcare: Johnson & Johnson, Pfizer, Moderna, UnitedHealth
  • Retail: Walmart, Target, Home Depot, Costco

Enterprise Application Advantages:

  • Volume strategy: Multiple applications across company divisions
  • Timing optimization: Application during peak hiring cycles
  • Referral identification: LinkedIn network mapping for internal connections
  • Salary benchmarking: Enterprise-level compensation analysis

Enterprise Salary Premiums:

  • Fortune 100: 25-40% salary premium vs. mid-market companies
  • FAANG companies: 40-60% total compensation premium
  • Top consulting firms: 35-50% compensation premium

Still have questions?

Our team is here to help. Book a call with our founder to get personalized answers.

Quick Response
Direct Call
Flexible Scheduling

Limited slots available. Book your call now!