Data Analyst Resume Examples, Templates & Writing Guide

Written by: Scale.jobs EditorialLast updated: May 1, 2026


Introduction
Build an effective data analyst resume that demonstrates your proficiency in SQL, data visualization, and translating complex datasets into actionable insights that drive strategic business decisions.
This guide walks you through every major section of a data analyst resume, with practical tips you can apply today.
- How to present SQL querying and data manipulation expertise with practical work examples
- Strategies for showcasing dashboard creation and data visualization skills on your resume
- Techniques for quantifying analytical contributions through revenue impact and efficiency gains
- Best practices for describing stakeholder communication and cross-functional collaboration
- Methods for highlighting statistical analysis and reporting automation achievements
- How to tailor your data analyst resume to match industry-specific analytical requirements


Data Analyst resume guide
Below, you will find section-by-section guidance for your data analyst resume — from your opening summary through skills and experience. Tailor every line to the job you want.
Professional Summary
Your professional summary should position you as an analyst who transforms raw data into business decisions. State your years of experience and the analytical tools you rely on daily, such as SQL, Python, Tableau, and Excel. Reference the business domains where you have applied your analytical skills, whether marketing analytics, financial reporting, operations optimization, or product analytics. Include a headline achievement that connects your analysis to a business outcome, such as developed a customer segmentation dashboard in Tableau that informed a targeted marketing campaign generating one point two million dollars in incremental revenue. Mention your ability to work with cross-functional teams including marketing, finance, product, and engineering to frame your communication skills. Conclude with the type of analytical challenges that motivate you, helping hiring managers assess alignment with their team needs.
Work Experience
Structure each role with four to six bullet points that demonstrate the analytical lifecycle from question formulation through data extraction, analysis, visualization, and stakeholder presentation. Begin each bullet with action verbs like analyzed, visualized, automated, identified, or recommended. Quantify results with specific numbers: built an automated weekly revenue dashboard in Tableau that replaced a manual twelve-hour Excel process, saving the finance team six hundred hours annually. Describe the complexity of datasets you worked with including the number of data sources, record volumes, and joining logic required. Highlight cross-functional collaboration by explaining how you partnered with marketing to define KPIs or worked with engineering to improve data collection instrumentation. Include examples of ad hoc analysis requests where you delivered quick-turnaround insights that directly influenced leadership decisions.
Technical Skills
Organize your analytical skills into categories including querying languages, visualization tools, spreadsheet proficiency, statistical tools, and data platforms. Under querying list SQL as your primary skill with specific dialects like PostgreSQL, BigQuery SQL, or Snowflake SQL that you use in production. For visualization include Tableau, Power BI, Looker, or Google Data Studio depending on your experience. List Excel and Google Sheets with specific advanced capabilities like pivot tables, VLOOKUP and INDEX-MATCH functions, conditional formatting, and macro automation. Under statistical tools include Python with Pandas and Matplotlib, or R if relevant to your workflow. Add data platforms and ETL tools you interact with such as dbt, Airflow, or specific cloud warehouse interfaces. Avoid listing basic office skills and instead focus on analytical competencies that differentiate you from general business professionals.
Key Analytical Projects
A projects section lets you showcase end-to-end analytical work that demonstrates initiative and business impact beyond routine reporting. Include two to four projects describing the business question, your analytical methodology, the tools used, and the quantified outcome. A strong entry might describe analyzing customer churn patterns across two years of subscription data using cohort analysis and survival curves in Python, identifying three key churn drivers that informed a retention strategy reducing monthly churn by fifteen percent. Include dashboard projects with descriptions of the metrics tracked, the number of stakeholders served, and the decision-making processes your dashboards supported. Projects are especially valuable for analysts transitioning from other roles or early in their careers, as they demonstrate applied analytical thinking in business contexts.
Certifications & Education
List relevant certifications such as Google Data Analytics Professional Certificate, Tableau Desktop Specialist, Microsoft Certified Data Analyst Associate for Power BI, or IBM Data Analyst Professional Certificate alongside the issuing organization and completion year. These certifications validate tool-specific proficiency and structured analytical training. In the education section include your degree, institution, and graduation year. Data analyst roles accept degrees from diverse fields including business, economics, statistics, mathematics, computer science, and social sciences. Highlight quantitative coursework in statistics, econometrics, or data management if relevant to the target role. For career changers entering data analytics from unrelated fields, emphasize certifications and portfolio projects that demonstrate your analytical capabilities.
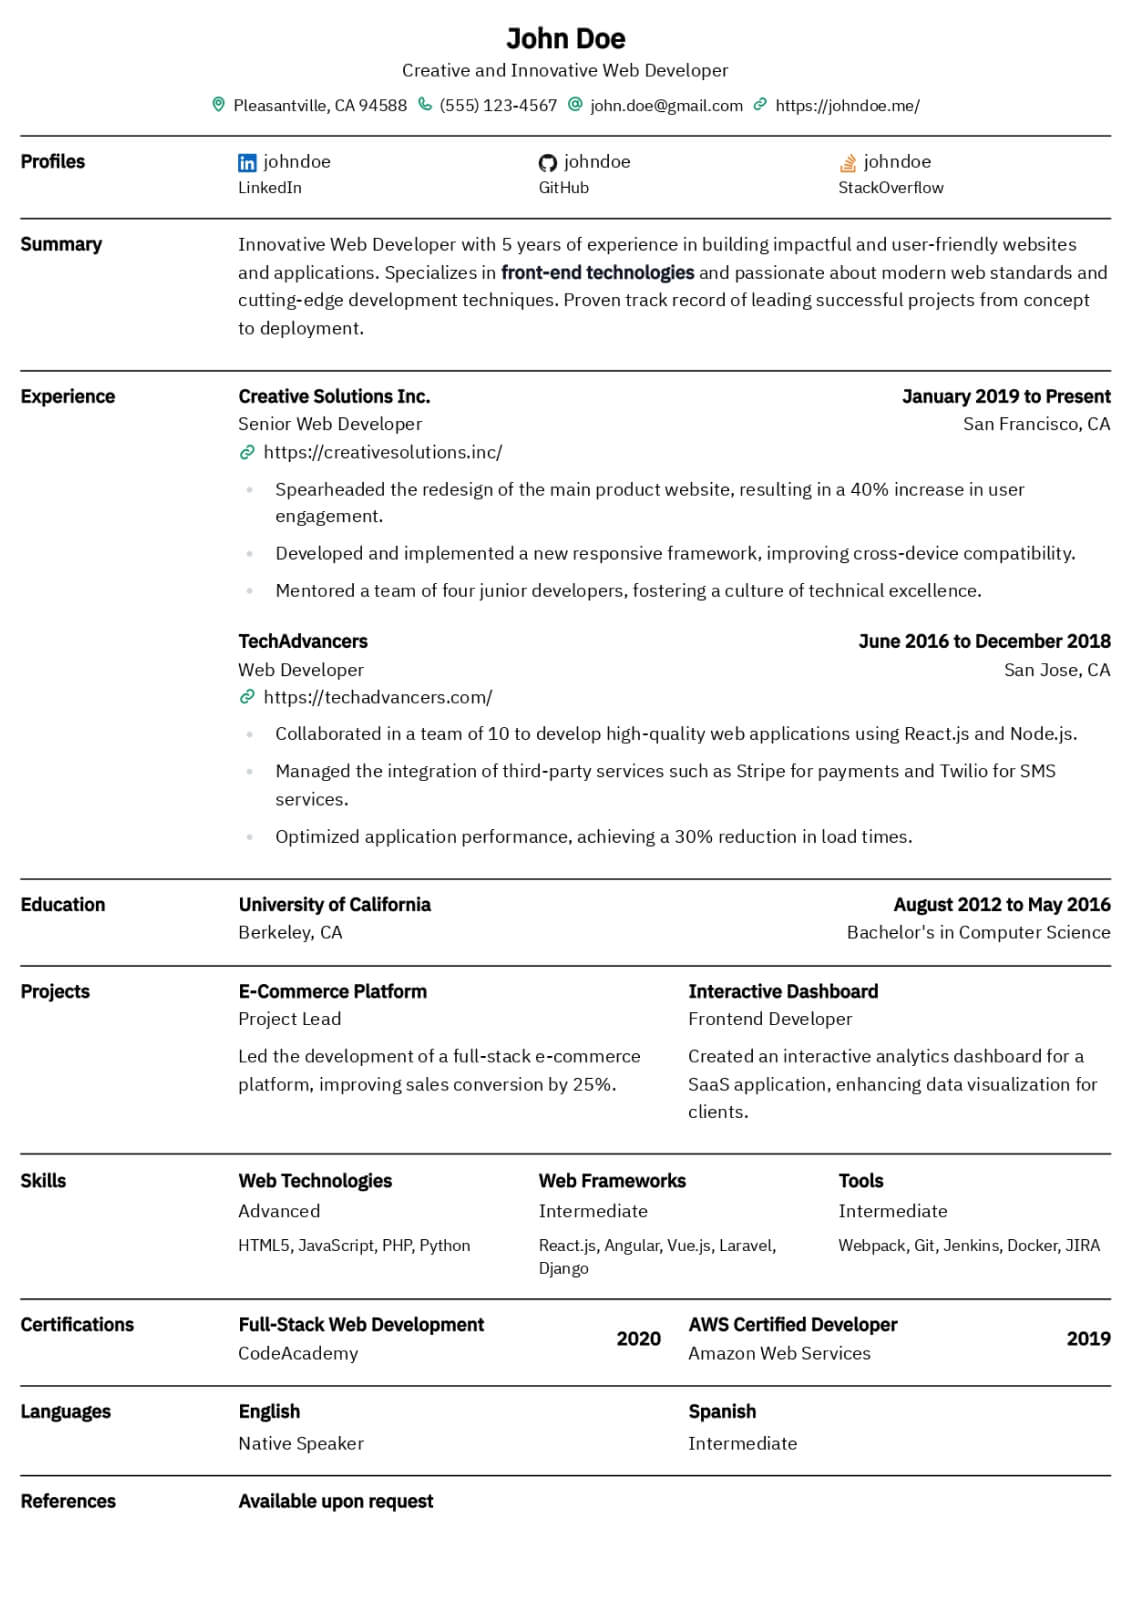
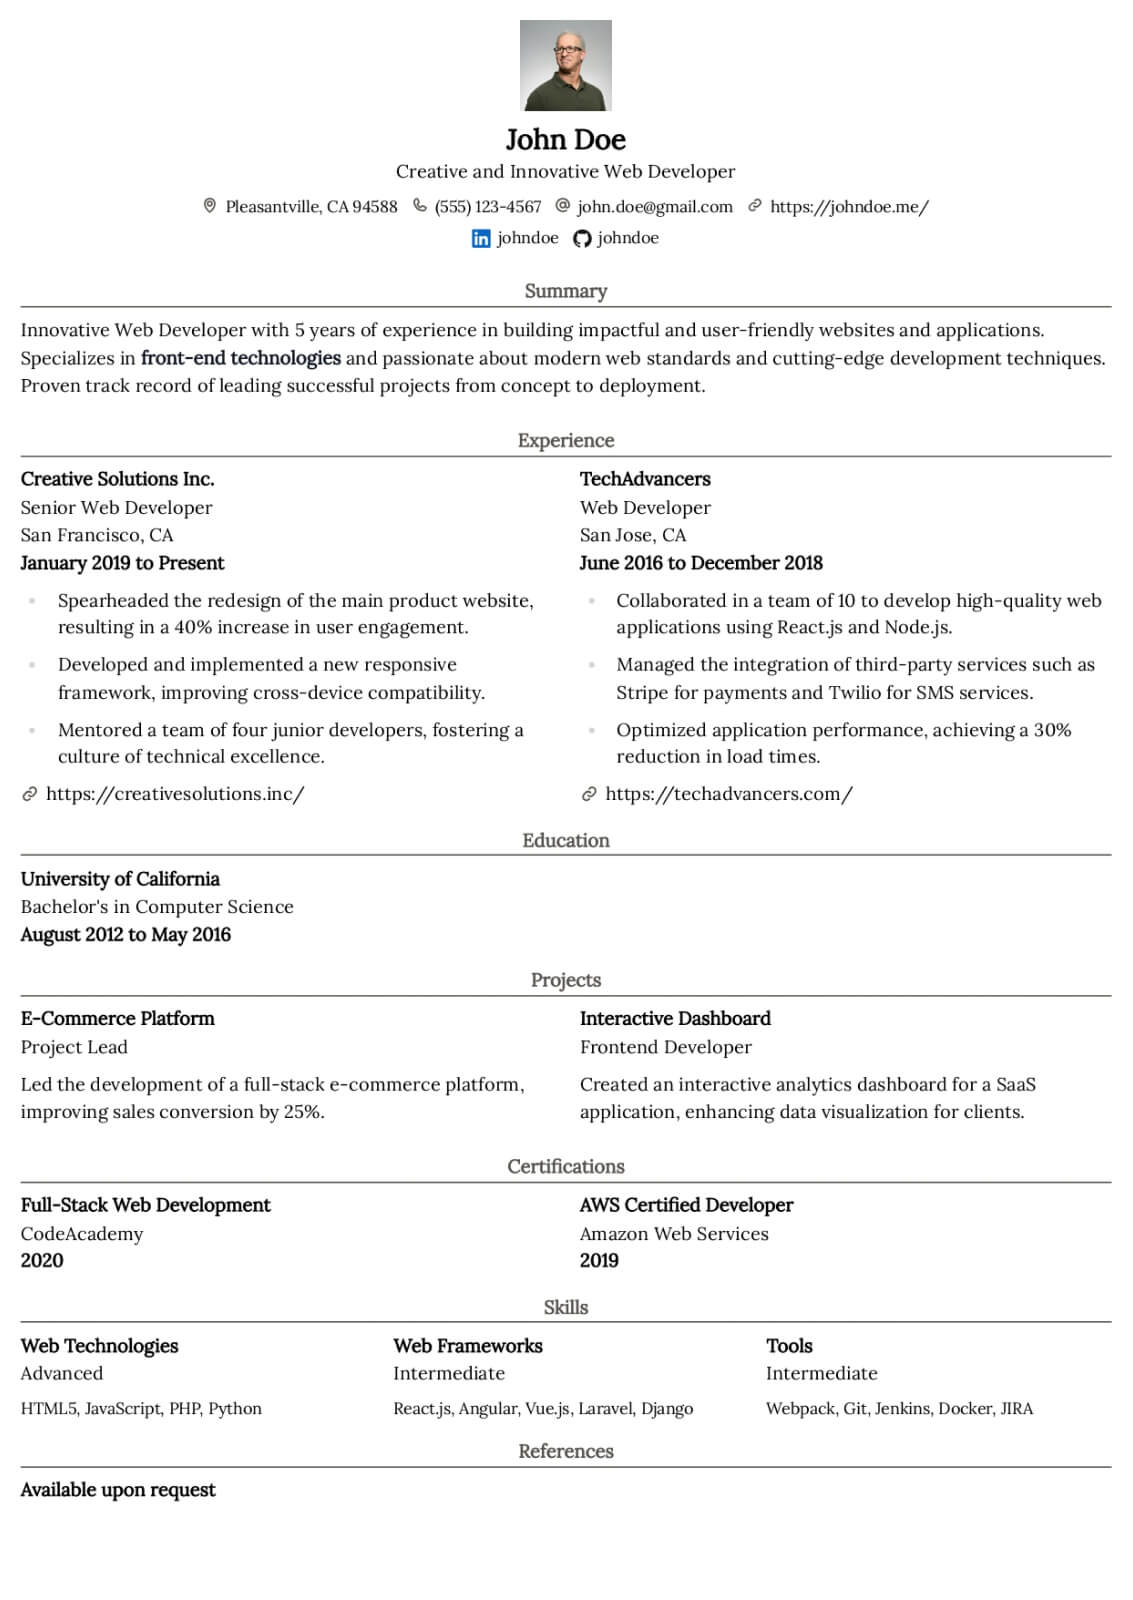
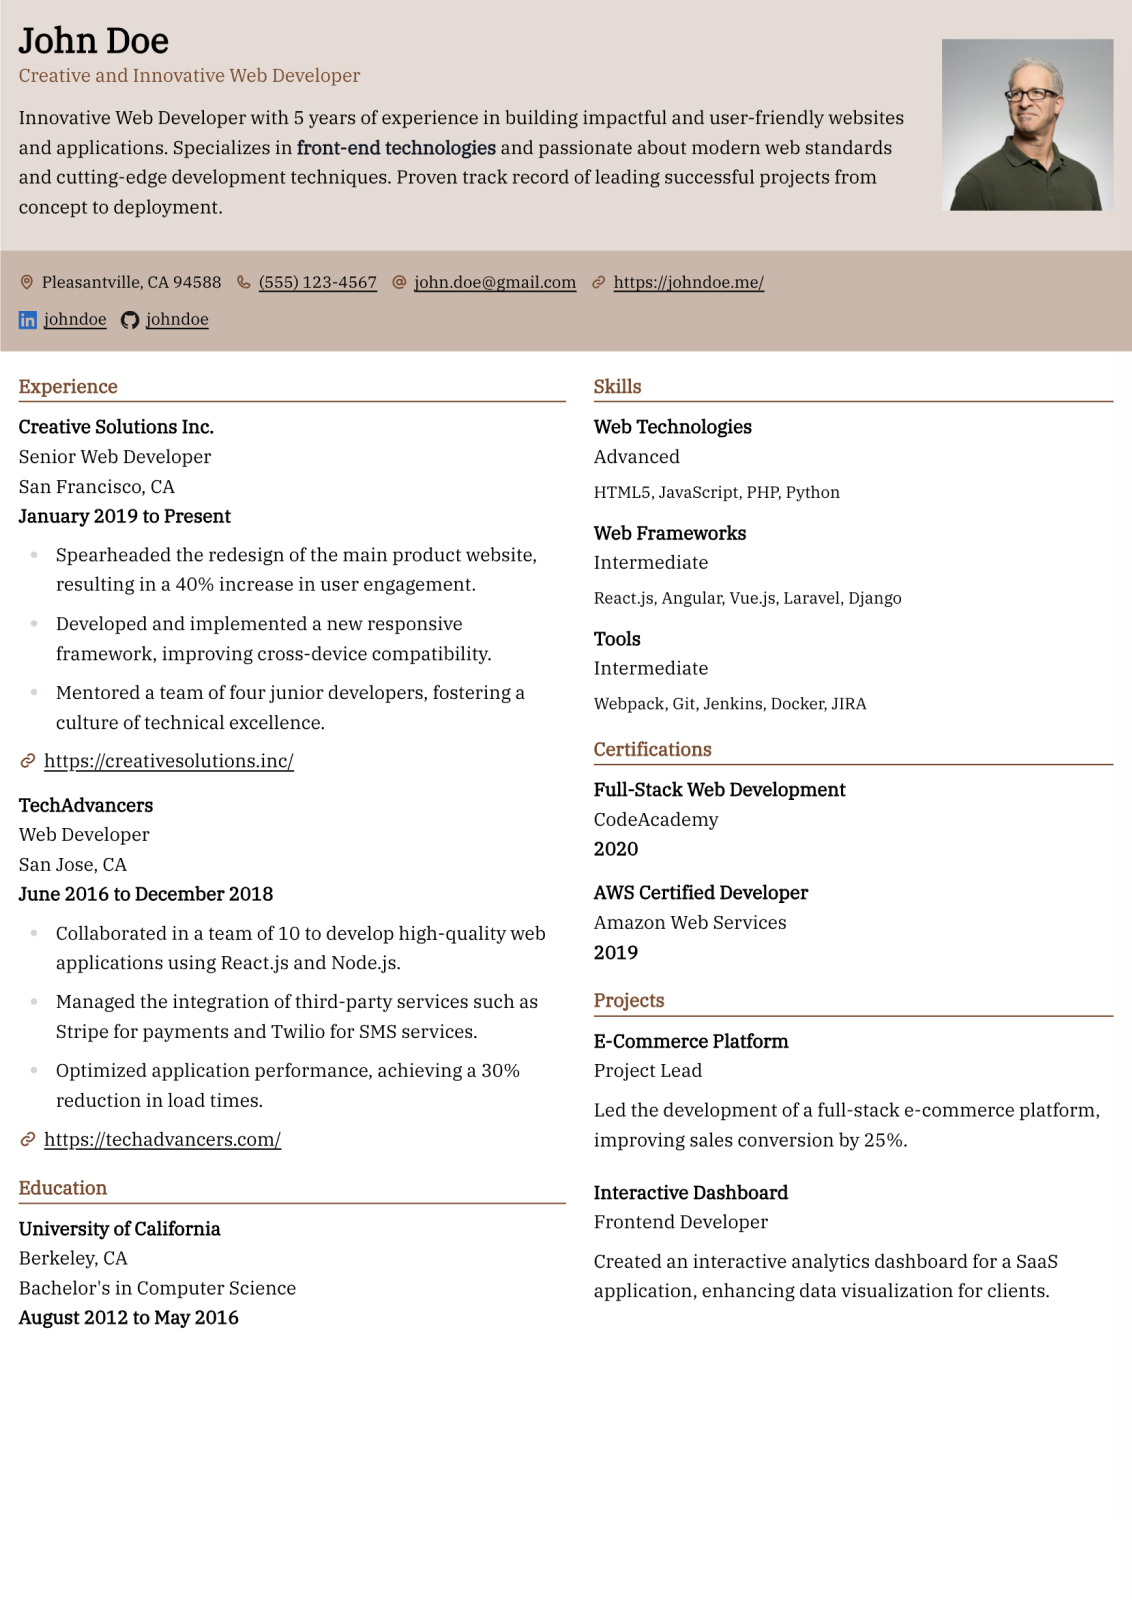
Layout & ATS Optimization
Use a clean single-column format with standard section headings to ensure your resume parses correctly in applicant tracking systems. Embed relevant keywords from the job posting naturally within your experience and skills sections, targeting terms like SQL, Tableau, data visualization, statistical analysis, and reporting. Avoid creative layouts that might confuse ATS parsers despite the temptation to demonstrate visual design skills. Include specific metric values in your experience bullets to create scannable, high-impact descriptions that catch the attention of hiring managers during their initial six-to-eight-second resume scan. Save as PDF and keep your resume to one page for candidates with fewer than seven years of experience. Include links to your Tableau Public profile or GitHub portfolio where applicable.
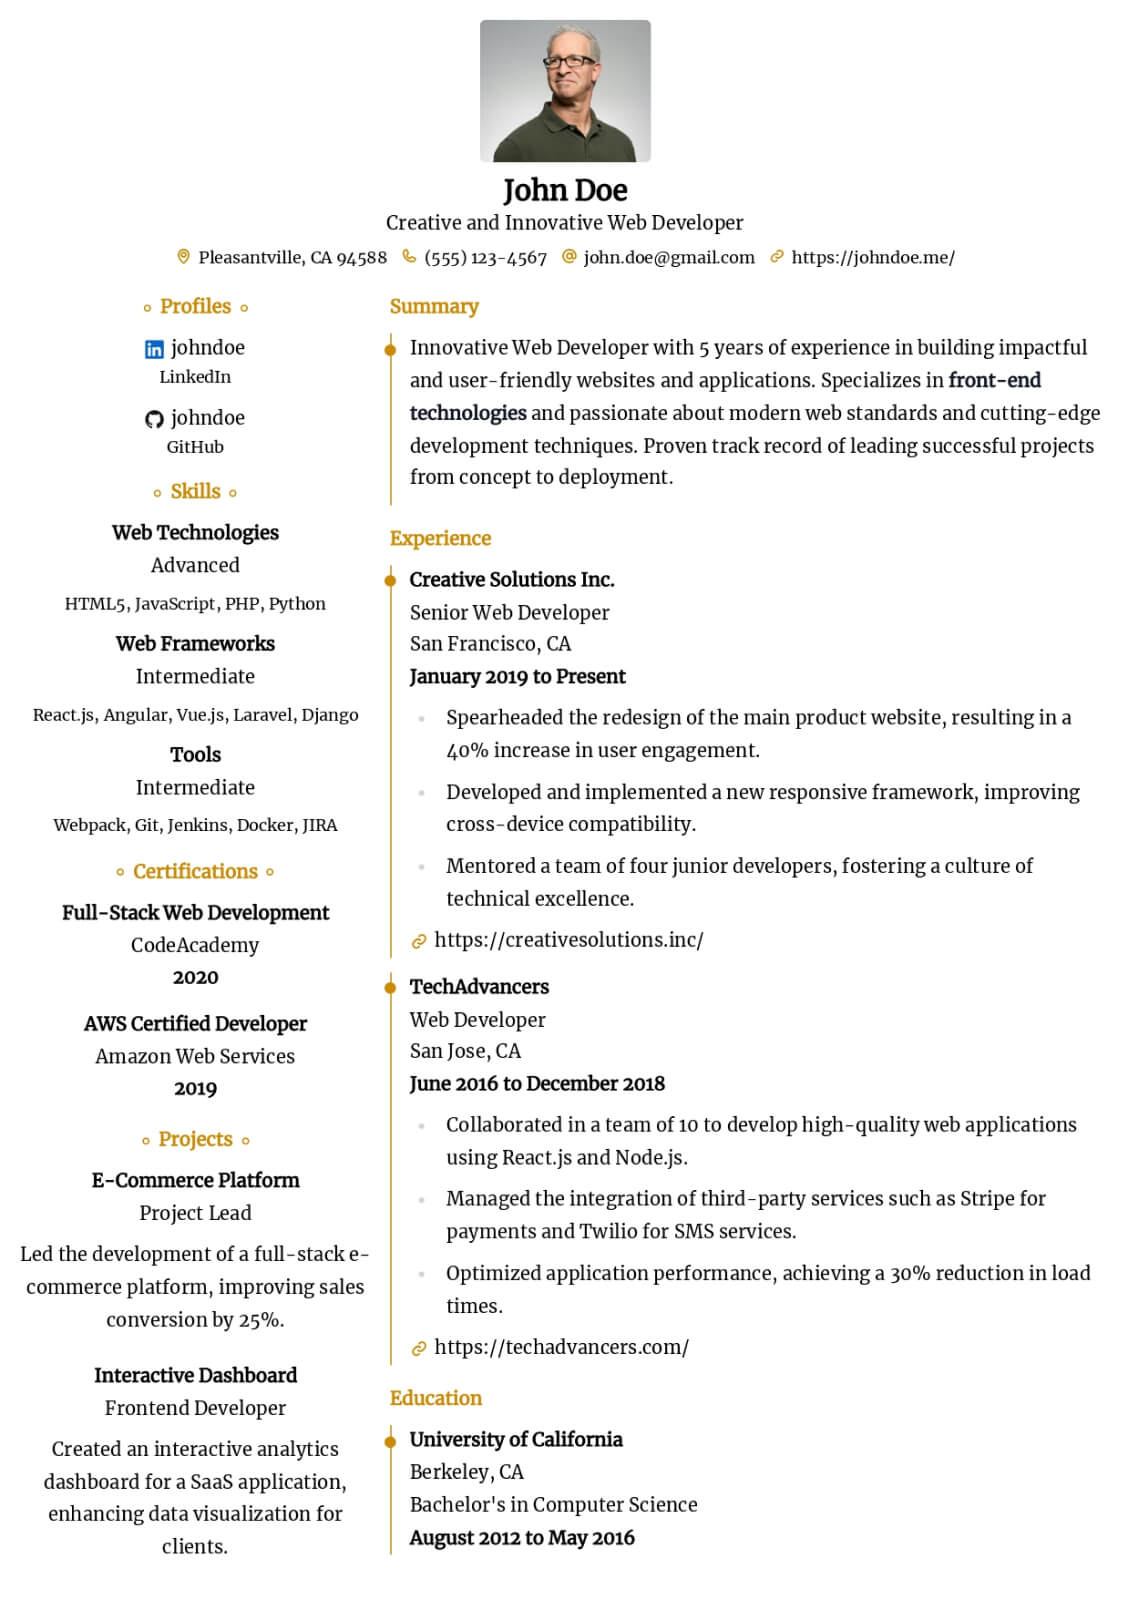
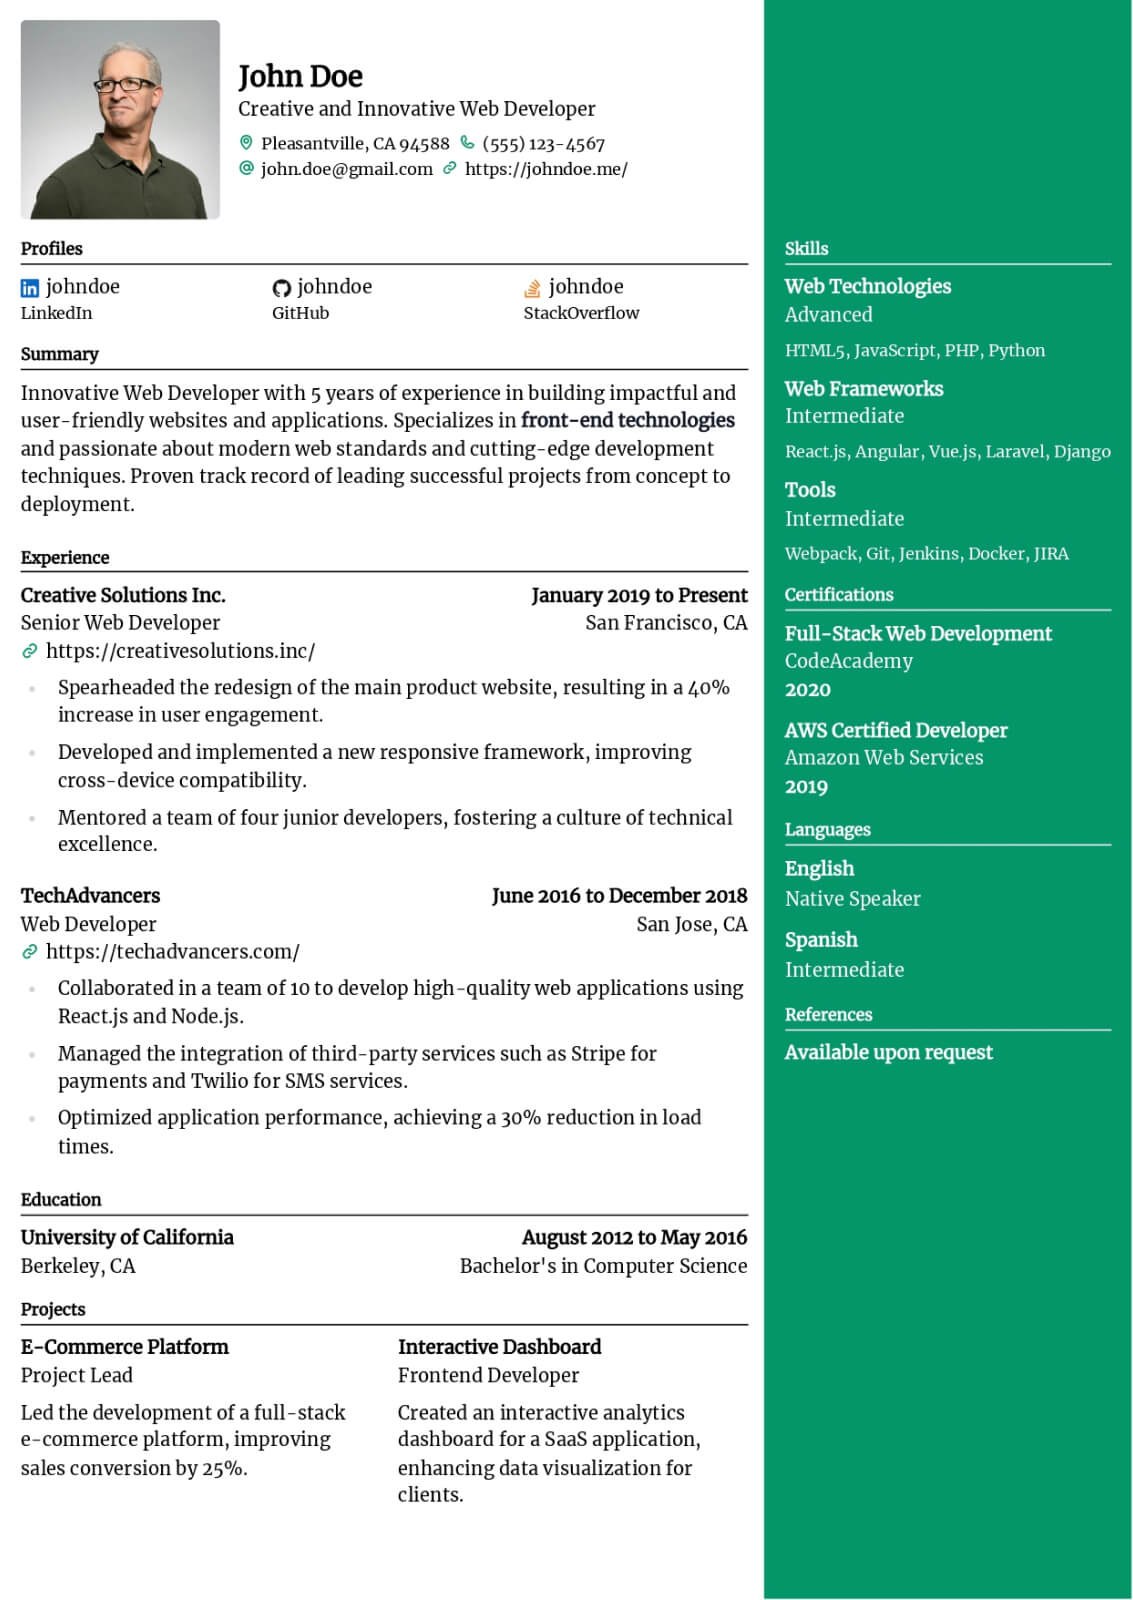
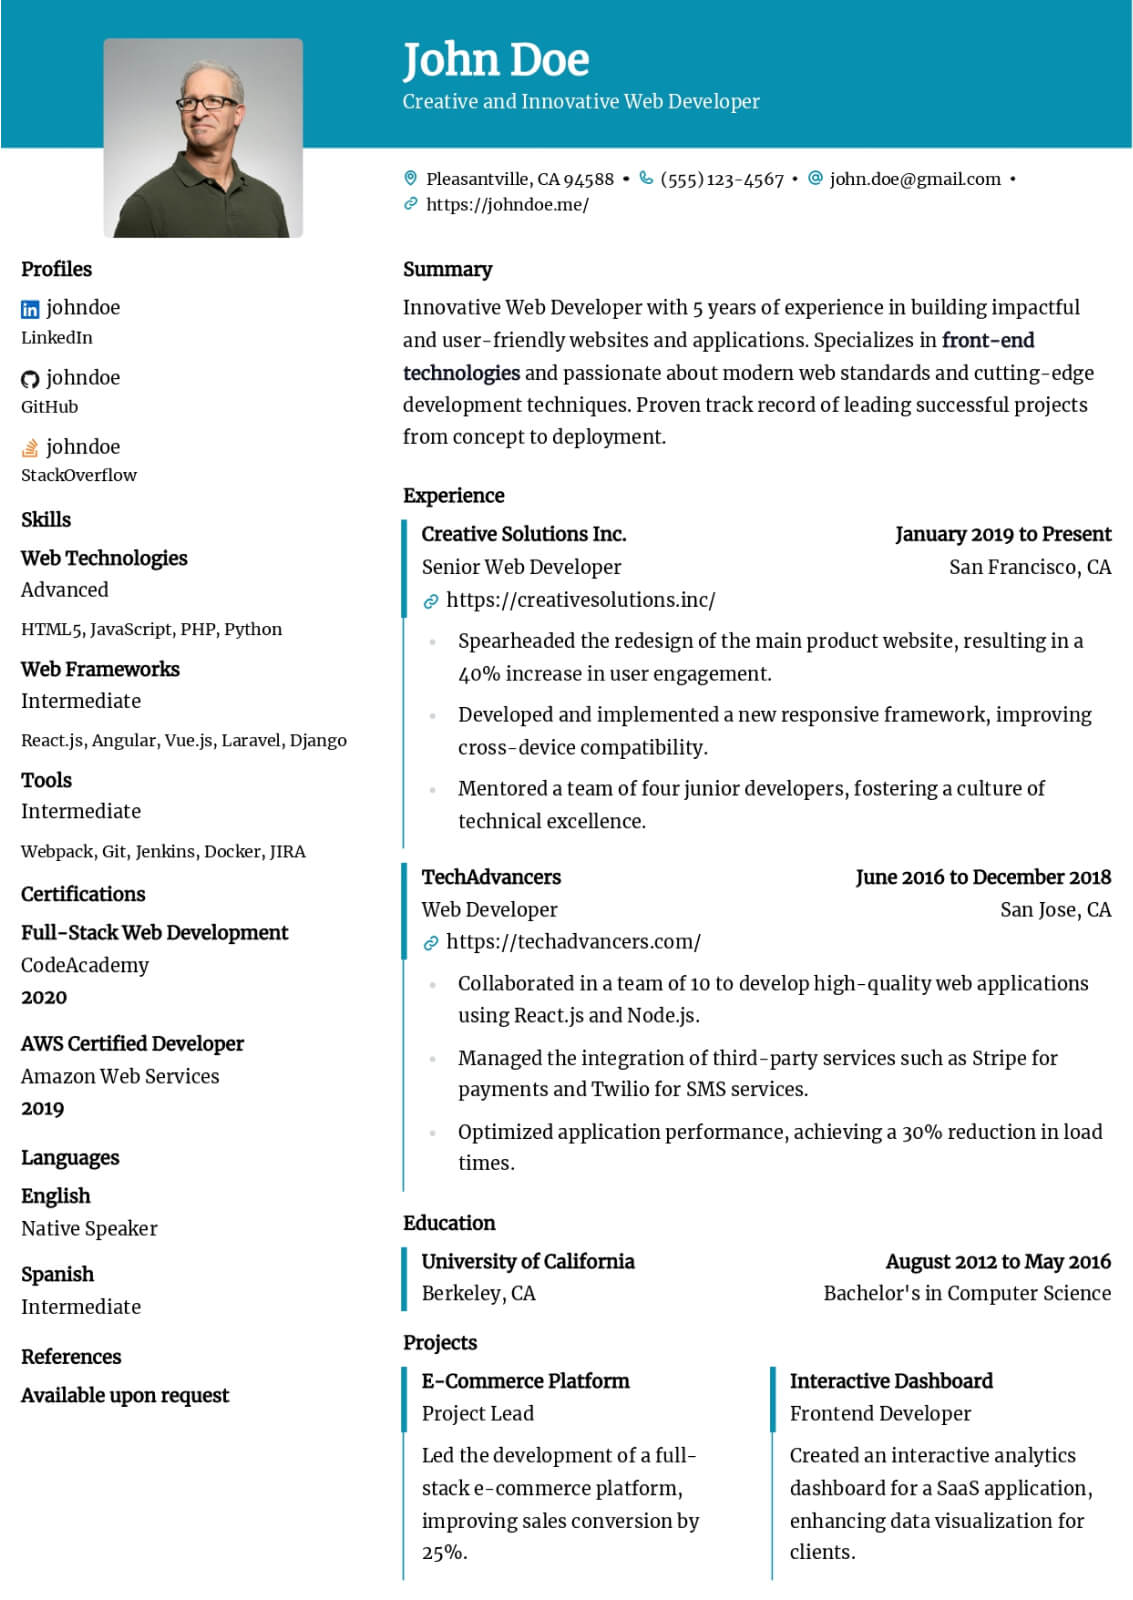
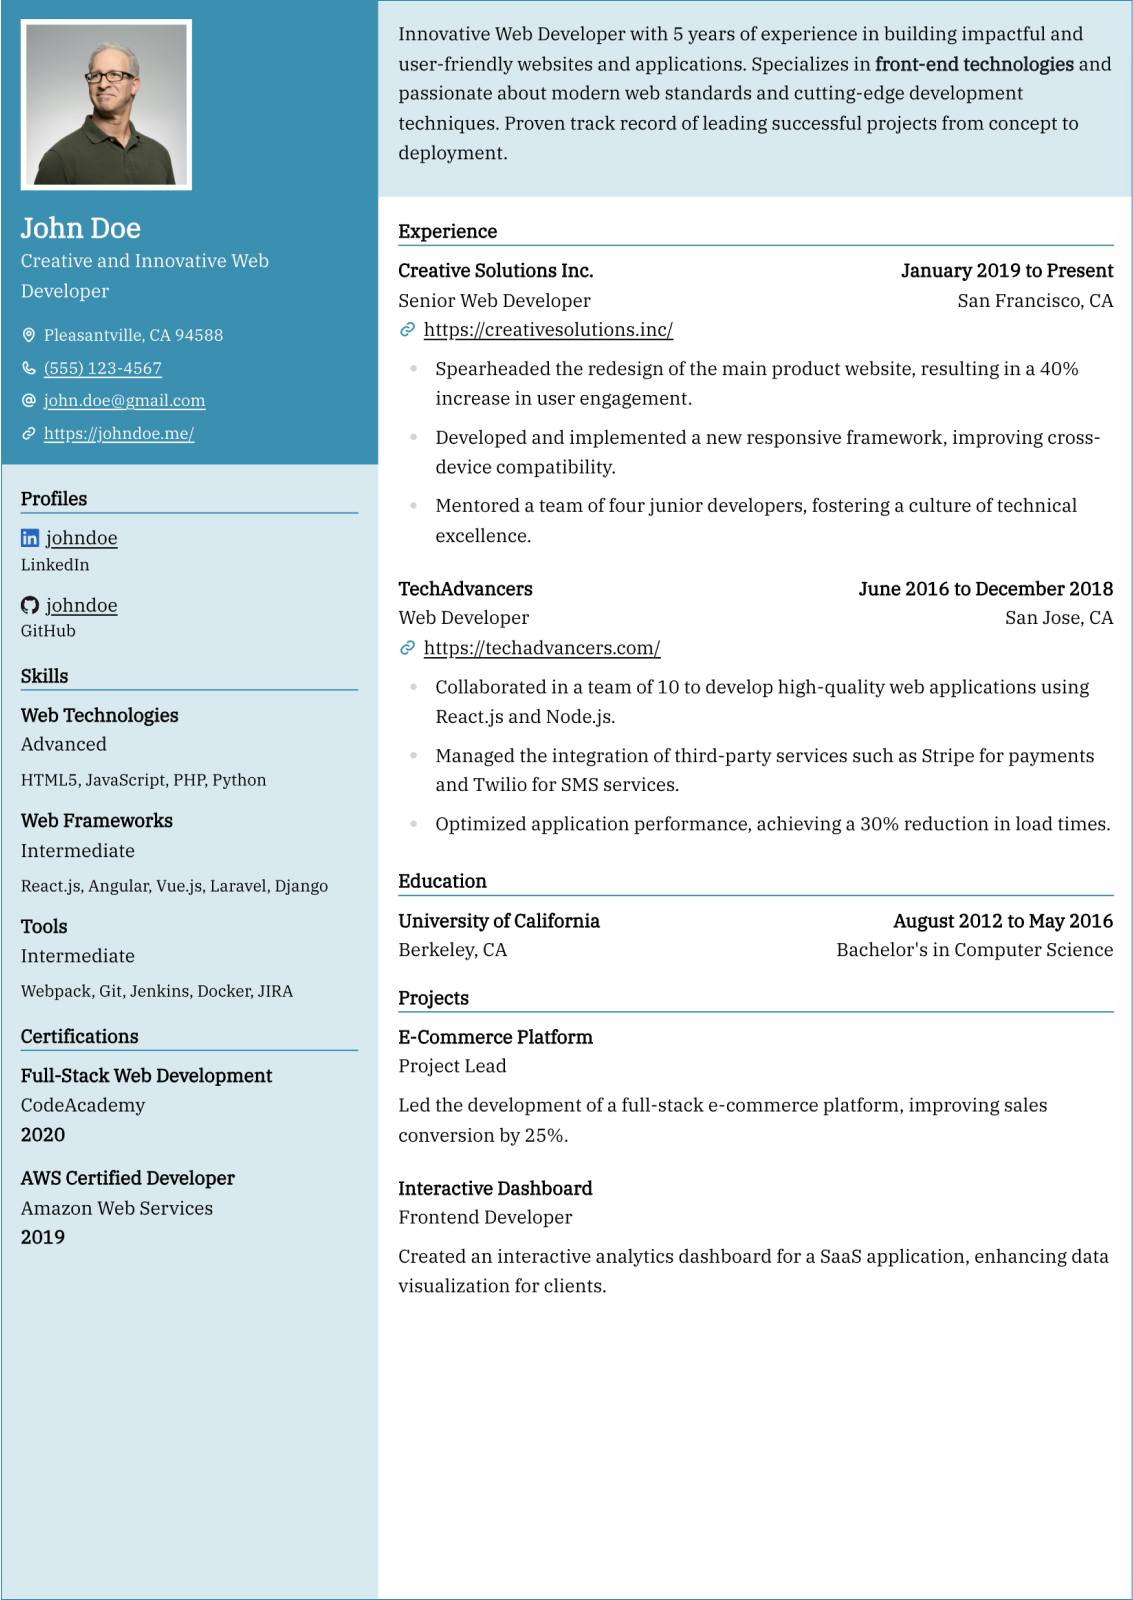
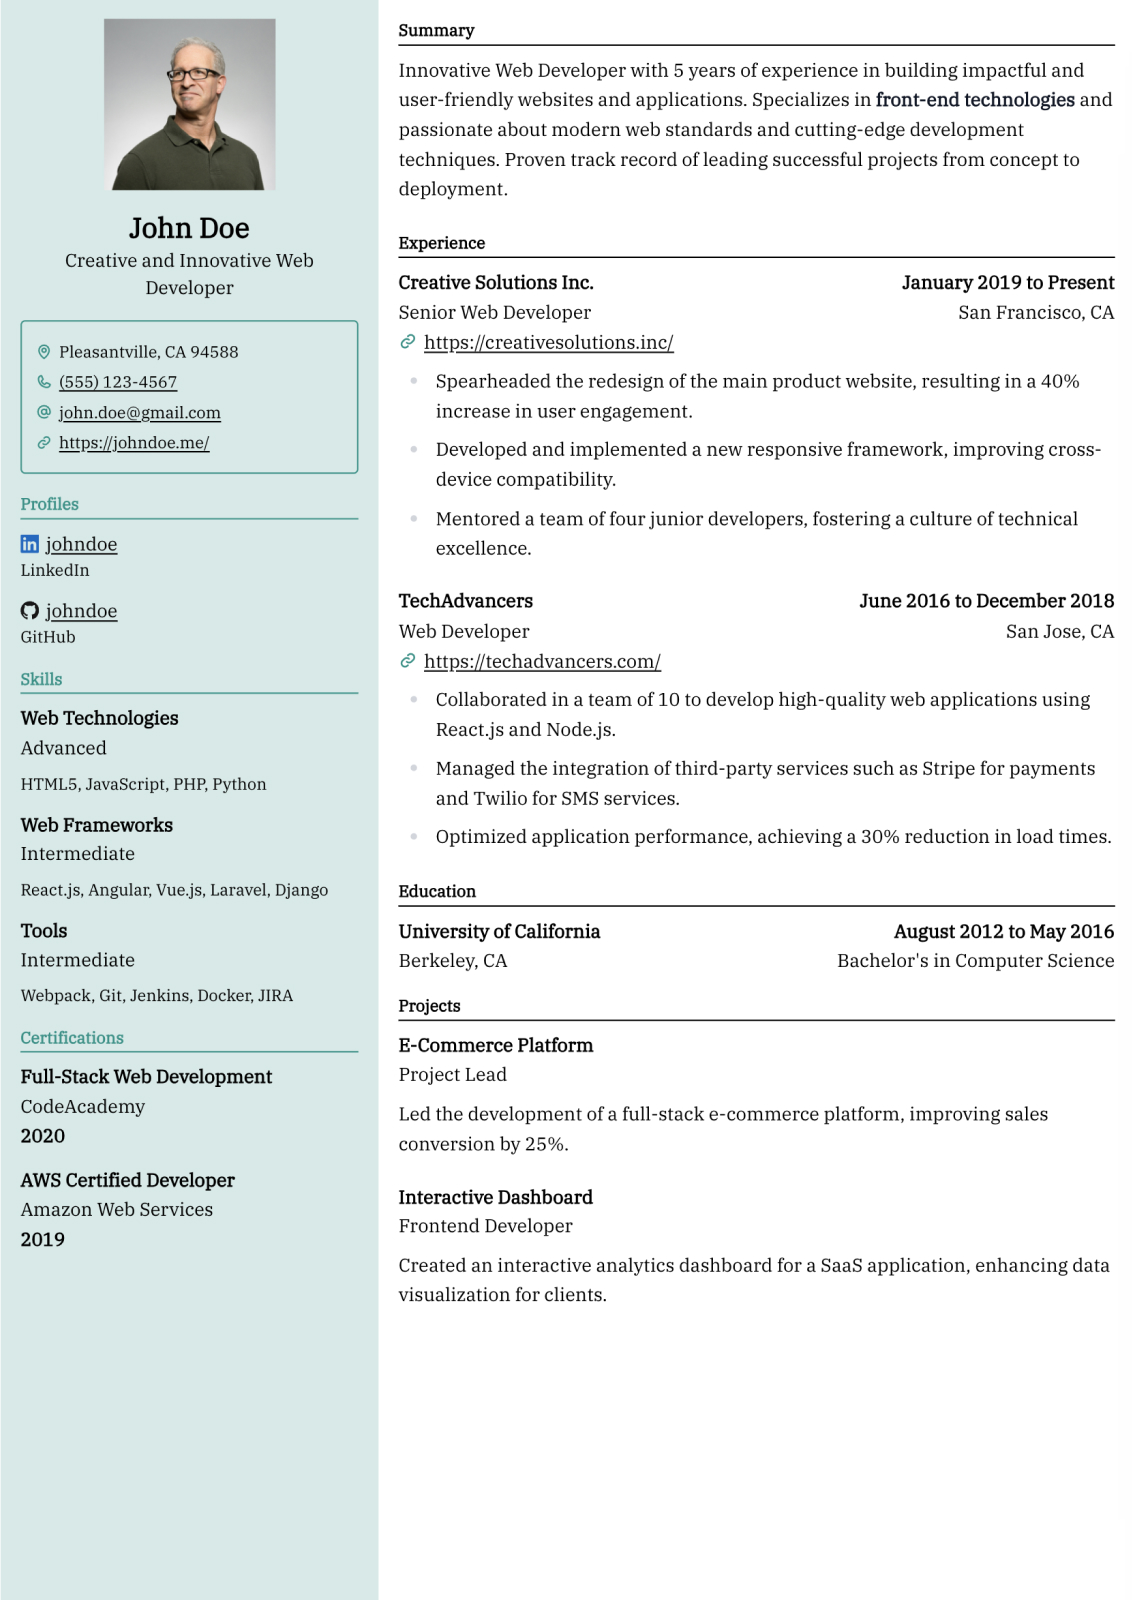
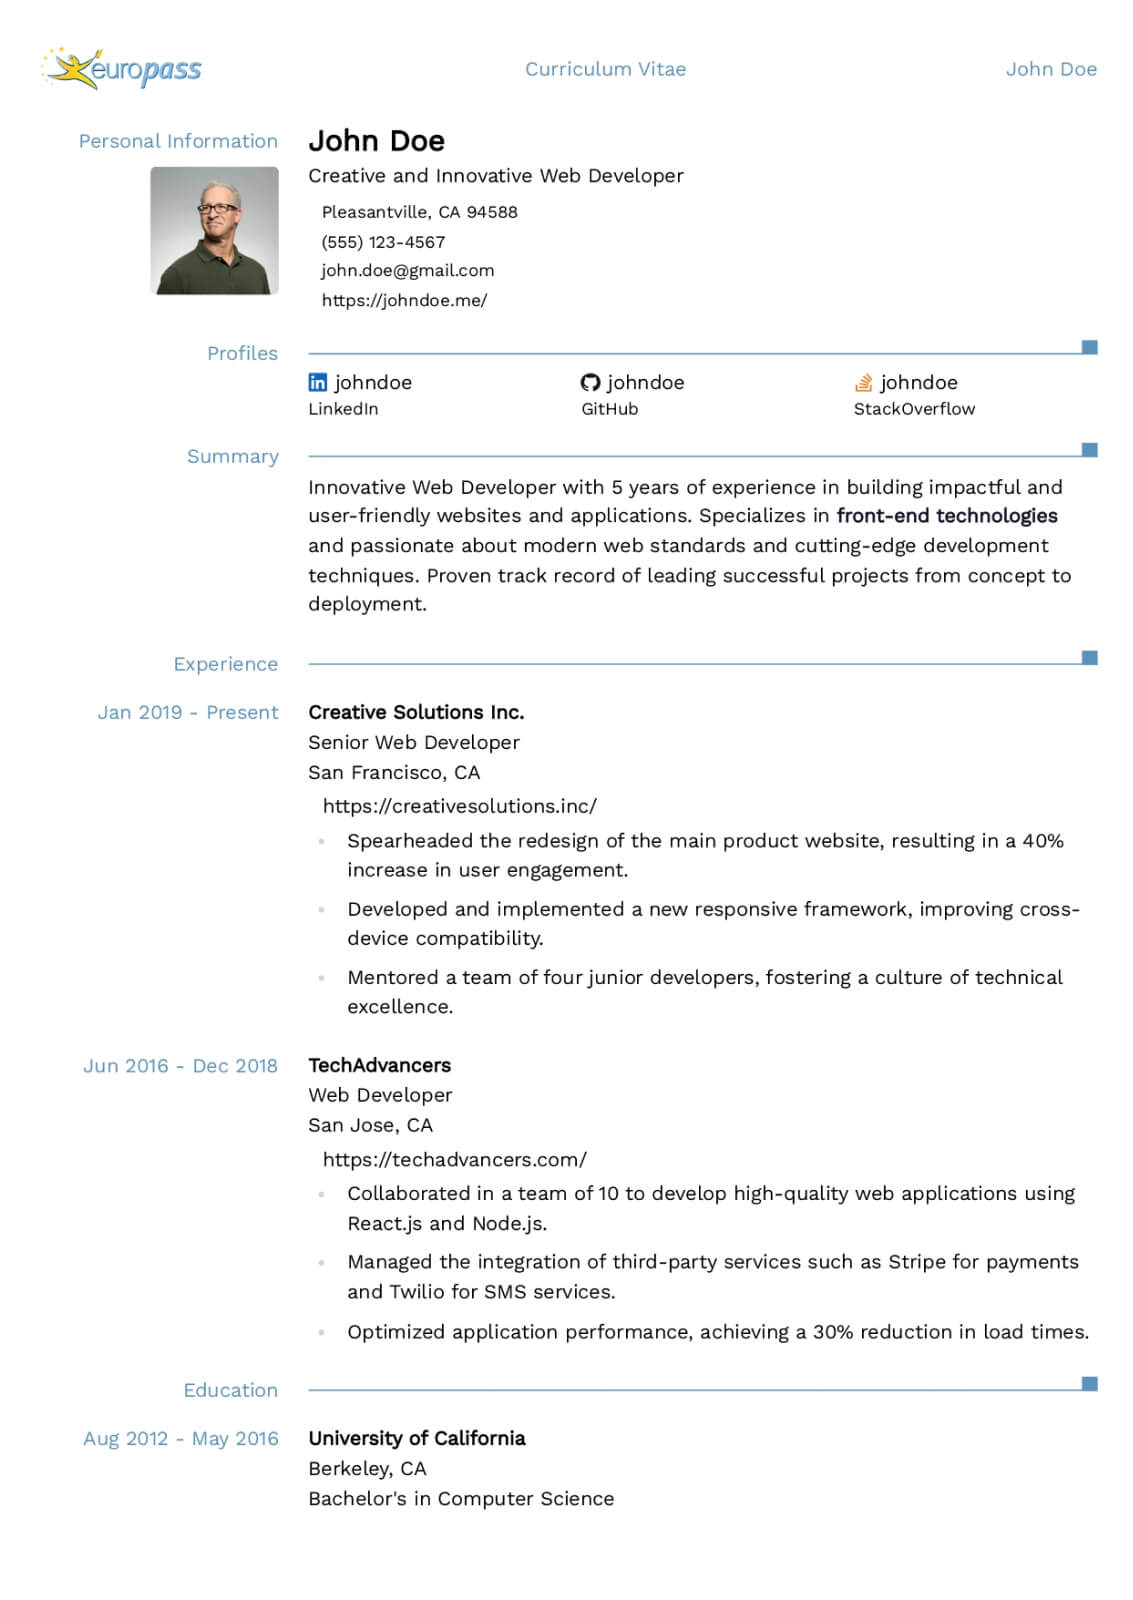
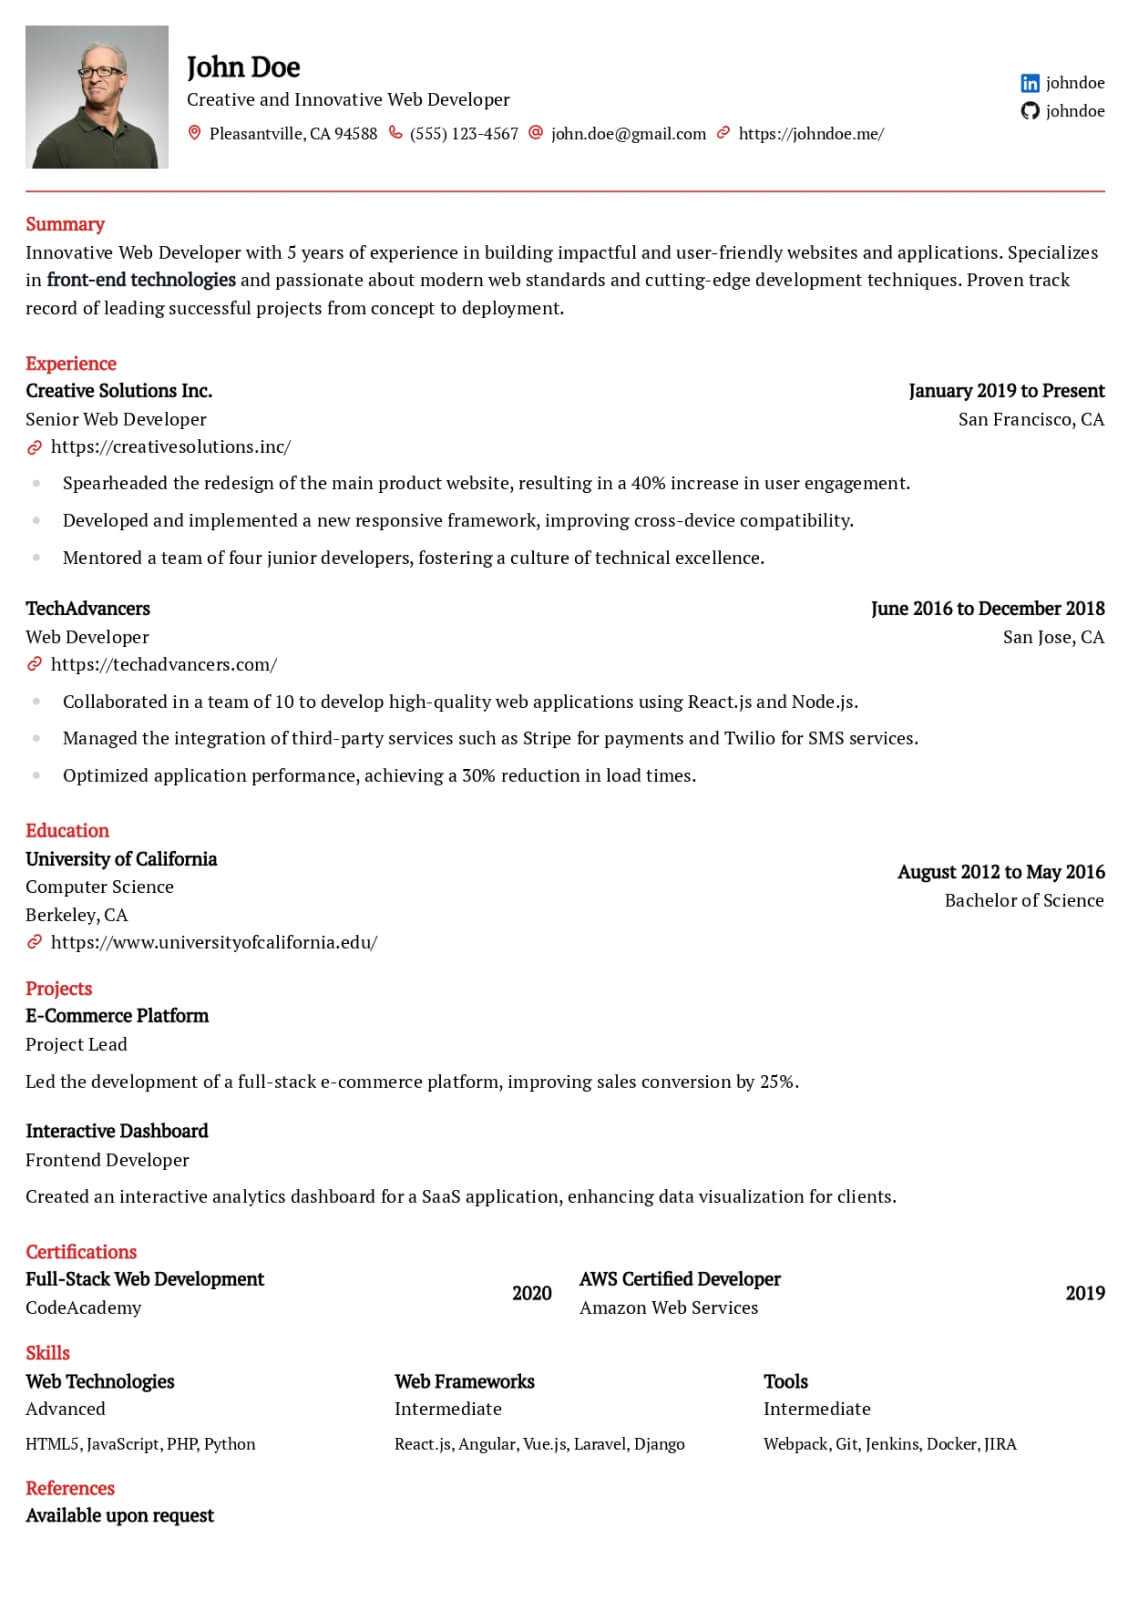
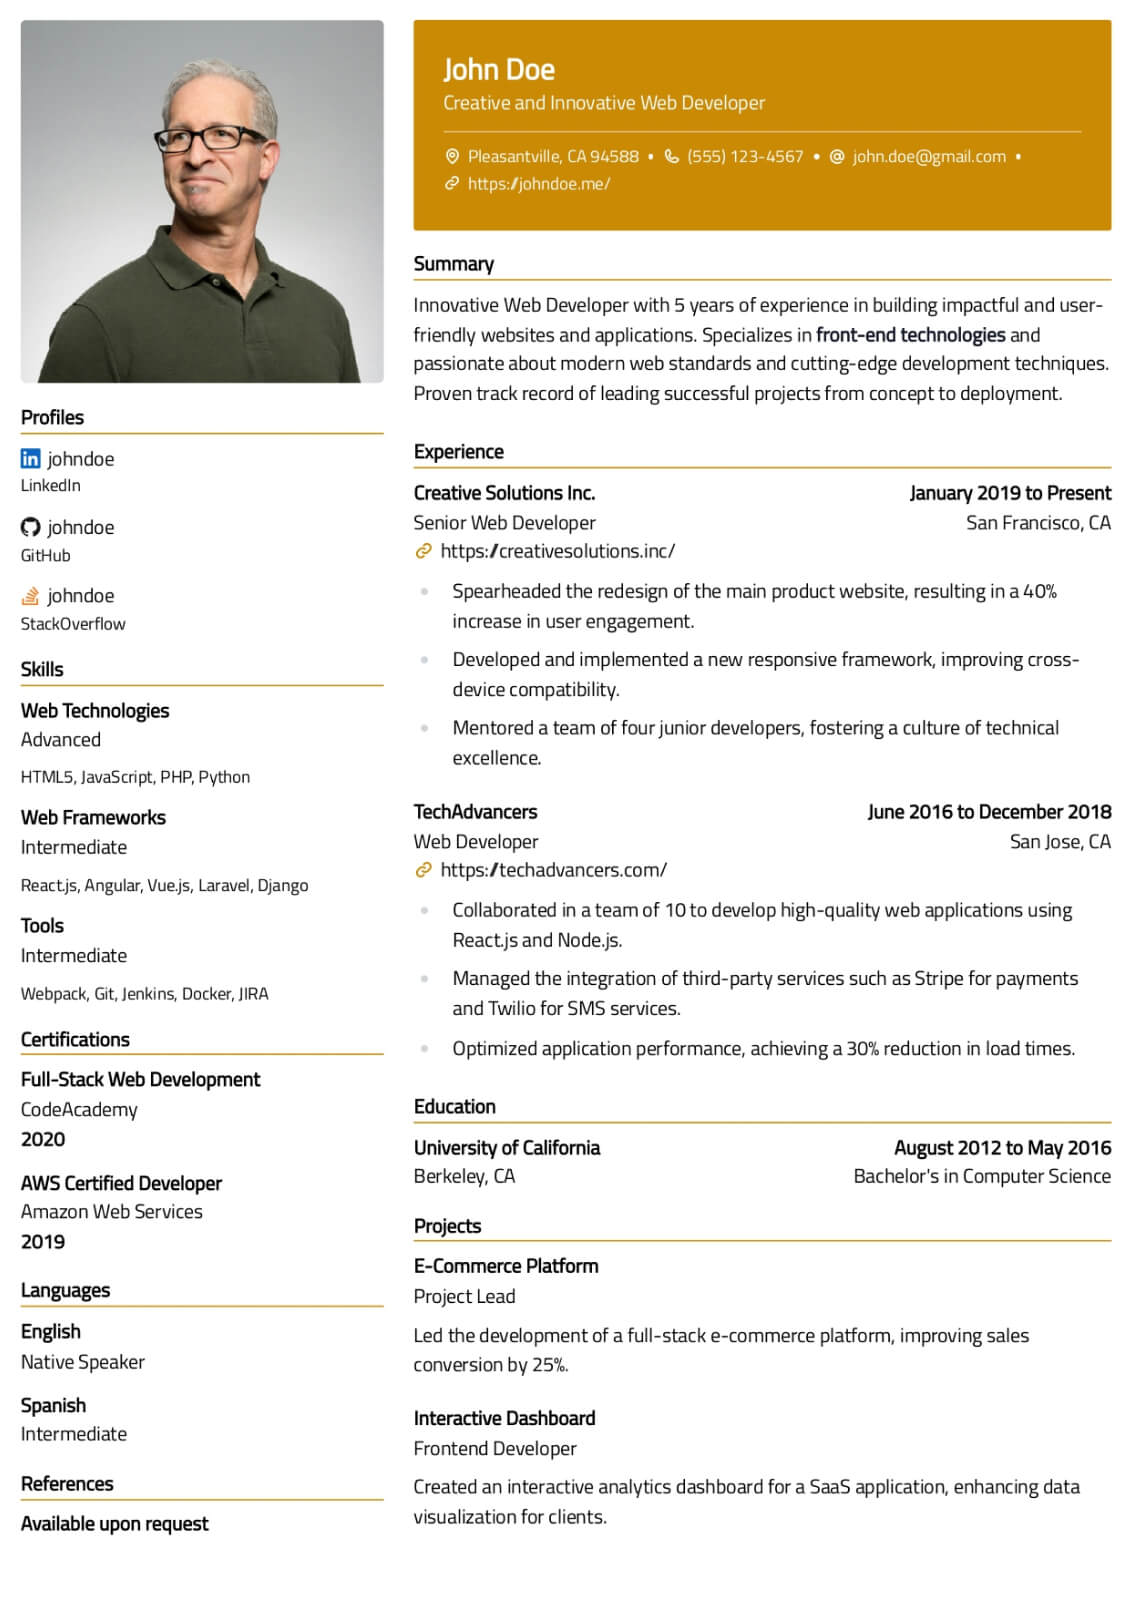
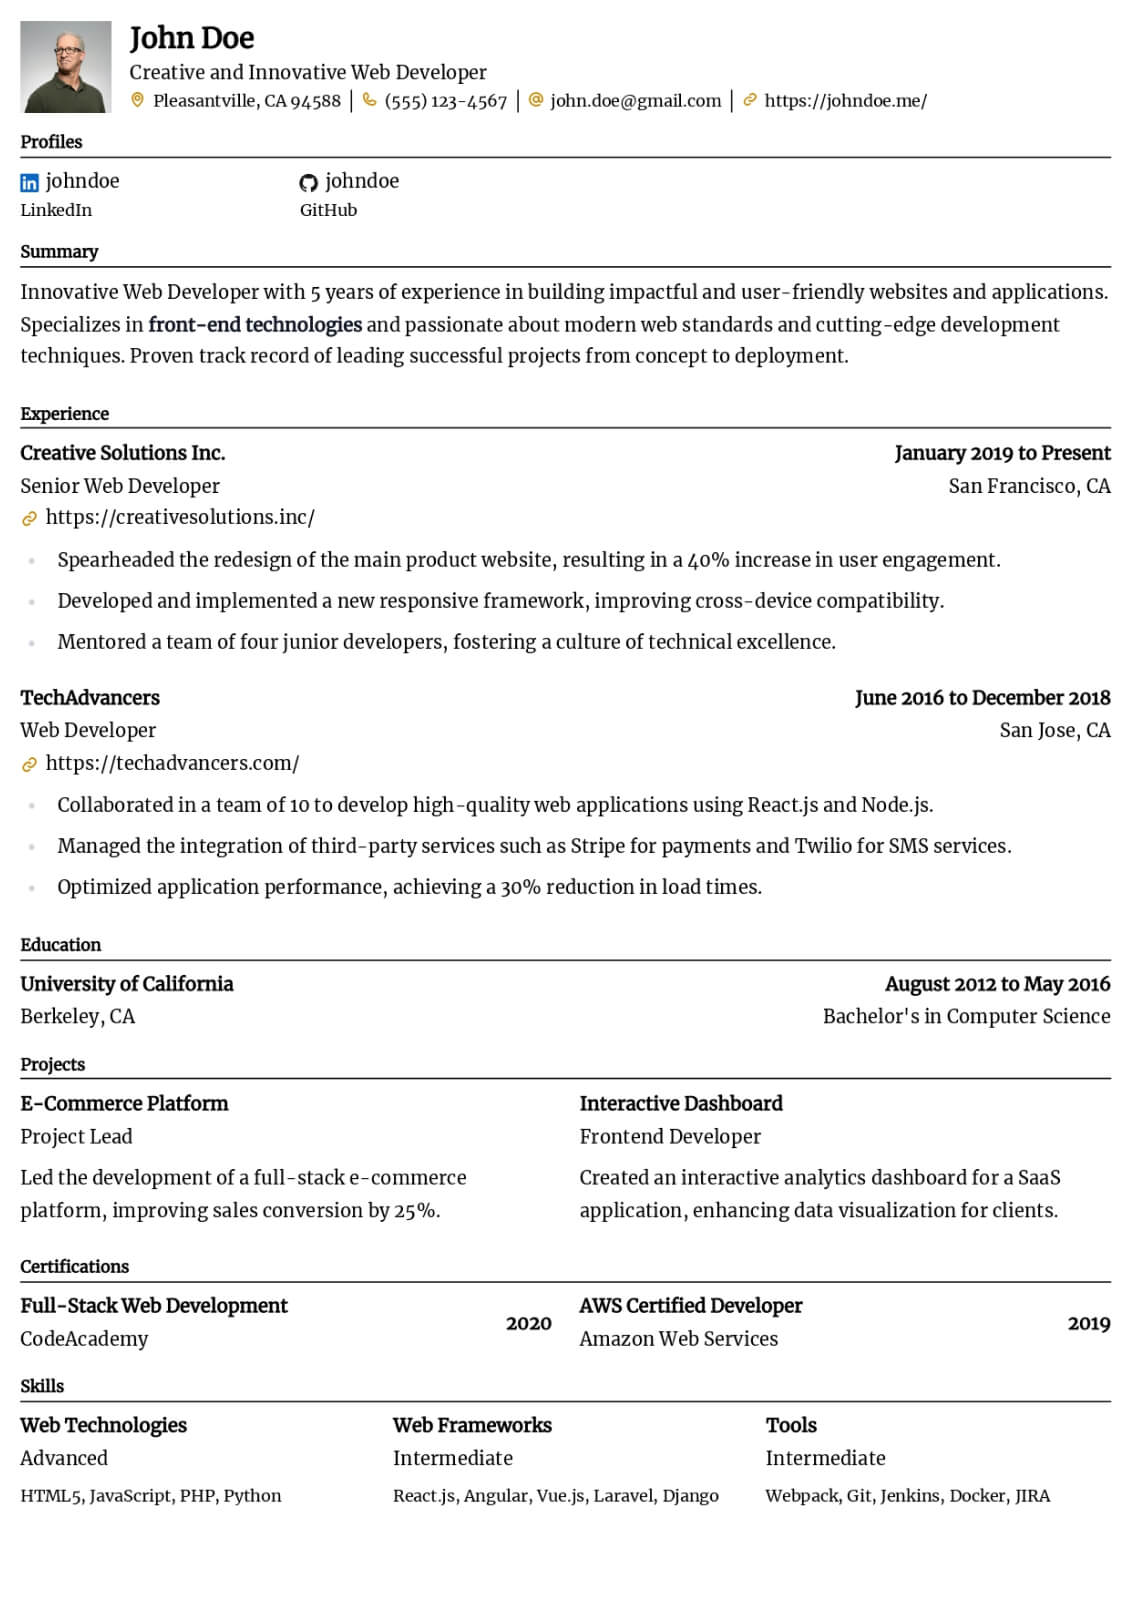
Resume layout and formatting
Use a clean, single-column layout with clear section headings and plenty of white space. Lead with technical strengths such as SQL (PostgreSQL, BigQuery, Snowflake), Tableau / Power BI / Looker, Excel & Google Sheets (Advanced), Python (Pandas, Matplotlib, Seaborn), Statistical Analysis & Hypothesis Testing, Dashboard Design & KPI Reporting, then reinforce interpersonal strengths like Business Acumen & Strategic Thinking, Stakeholder Communication, Data Storytelling & Presentation, Attention to Detail. Keep fonts standard (e.g., Arial or Calibri) at 10–12pt body size so your resume stays ATS-friendly and easy to scan.
Key takeaways
- Lead with your core analytical tools and a headline business impact achievement
- Quantify every analysis with revenue, cost, efficiency, or time-saving metrics
- Describe dashboards and reports with the decisions and stakeholders they supported
- Include analytical projects that showcase end-to-end problem solving methodology
- Mirror SQL dialect names and visualization tool versions from the job posting
- Keep formatting clean and ATS-friendly with a single-column layout
Build your Data Analyst resume with Scale
Lead with your core analytical tools and a headline business impact achievement
Use This Template
Professional Templates That Make You Stand Out
Browse modern, ATS-friendly resume designs crafted to impress recruiters. Customize any template and download it as a Word or PDF file.
Listen What Our Users Have to Say

Rohan Sen
I am very happy with the team's quick turnaround time - any query is responded at utmost priority. Shoutout to my client manager, Anub Biju - very helpful.

Gael L
Service and communication is great, cover letters are non-ai sounding and well tailored. Just have a lot of communication and review with your staff!

Jonathan Parry
Wow - don't tell your peers! Wow, I can't recommend scale.jobs enough - it's so good I am not sharing with my peers. Applications at scale that get through filters. Thank you!

Cynthia Zhu
Great service! The scale.jobs team was very responsible and managed to apply tons of jobs for me in a very tight deadline to help me secure interviews quickly. Highly recommend to anyone who needs help applying to jobs!

Yash Yenugu
Save your fingers. Saved me from a thumb cramp because we're expected to effortlessly apply to jobs during these times.

Cian O'Driscoll
Clever service. Takes the hard effort out of applying for jobs with an intuitive dashboard and attention to detail. A great asset to job seekers. :-)
Frequently asked questions
What technical skills should a data analyst prioritize on their resume?
SQL is the most essential skill and should anchor your technical section. Follow with your primary visualization tool like Tableau or Power BI and advanced Excel capabilities. Python with Pandas is increasingly expected for analytical roles beyond basic reporting. Tailor your skill emphasis to match the specific tools mentioned in the job description you are targeting.
How do I transition to a data analyst role from a non-technical background?
Emphasize transferable analytical skills from your current role such as reporting, forecasting, or process optimization. Complete a recognized certification like the Google Data Analytics Certificate to validate foundational competencies. Build two to four portfolio projects analyzing real datasets with SQL, Tableau, and Python. Frame your domain expertise as a differentiator that provides business context most technical candidates lack.
Should I include Excel skills on a data analyst resume in 2026?
Advanced Excel skills remain relevant and valued across many industries, particularly in finance, operations, and consulting. Specify capabilities like pivot tables, Power Query, advanced formulas, and VBA macros rather than listing Excel generically. Position Excel alongside more modern tools to show that you can operate effectively in both traditional and contemporary analytics environments.
How do I describe dashboard work on my resume effectively?
Specify the visualization tool, the metrics tracked, the audience served, and the business decisions your dashboard enabled. For example, state that you designed a Tableau executive dashboard tracking twelve revenue KPIs across four product lines, used weekly by the C-suite to inform pricing and inventory decisions. Dashboards described with business context carry far more weight than standalone tool mentions.
What is the difference between a data analyst and a data scientist resume?
Data analyst resumes emphasize SQL proficiency, business intelligence dashboards, reporting automation, and stakeholder communication. Data scientist resumes focus more heavily on machine learning, statistical modeling, and predictive algorithm development. Position your resume based on the role you are targeting, highlighting the appropriate mix of analytical versus modeling experience.
How long should a data analyst resume be?
One page is ideal for analysts with fewer than seven years of experience. Ensure every line contributes measurable value and remove roles or details that do not support your analytical narrative. Senior analysts with extensive cross-domain experience may extend to two pages. Hiring managers spend seconds on initial scans, so prioritize density and clarity over comprehensiveness.
Related Resume Guides
Data Scientist
Build a compelling data scientist resume that demonstrates your statistical modeling expertise, machine learning proficiency, and ability to translate complex data insights into measurable business outcomes.
Business Intelligence Analyst
Create a data-driven business intelligence analyst resume that showcases your expertise in building dashboards, transforming raw data into strategic insights, and driving executive decision-making across organizations.
Data Engineer
Create a compelling data engineer resume that showcases your expertise in building scalable data pipelines, designing warehouse architectures, and enabling reliable analytics at petabyte scale.
Software Engineer
Craft a compelling software engineer resume that highlights your technical depth, system design expertise, and measurable contributions to production software used by millions of users worldwide.
Product Manager (Tech)
Build a high-impact technical product manager resume that communicates your ability to define product vision, align cross-functional teams, and deliver measurable business outcomes through data-driven prioritization.